Stacked Chart by Year – Market Trends Analysis
RJ0600008_13
- Last Update 06/22/2025
- File Size 0.1MB
- # of Slides 2
- File Format PPTX
- Slide Ratio 16:9
- Color
Keywords
About the Product
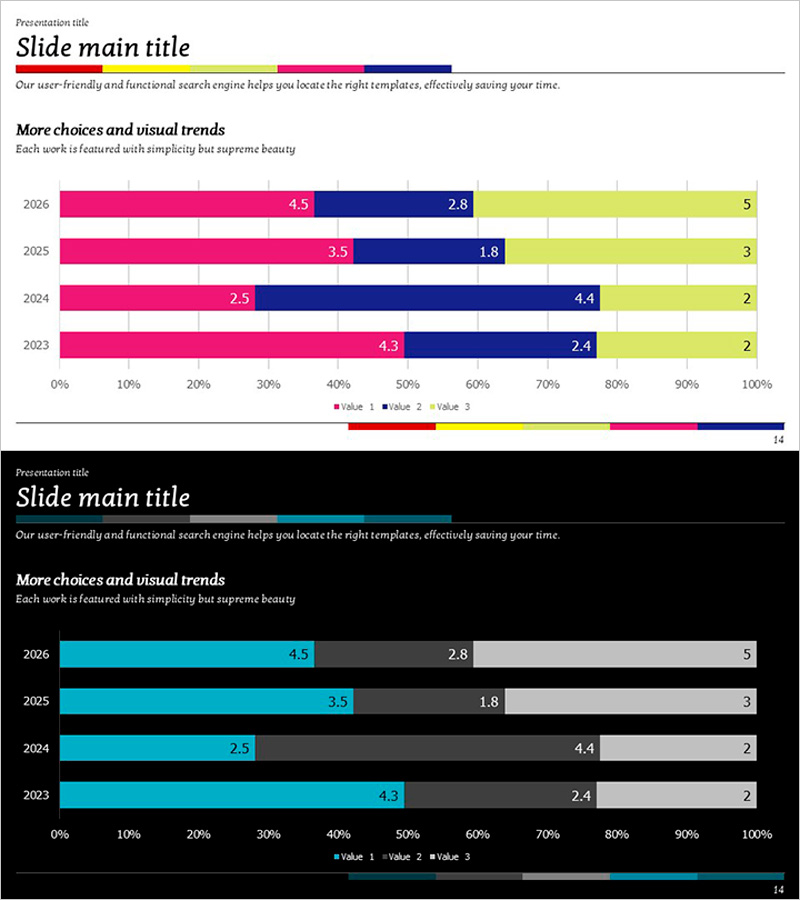
A market trends analysis PowerPoint slide featuring a stacked bar chart organized by year. The chart uses three distinct colors—magenta, navy, and lime—to segment and compare data across multiple years, making it ideal for visualizing market share shifts, competitive positioning, and trend trajectories. The 2-slide deck in 16:9 widescreen format includes clearly defined data entry fields that allow you to input figures directly and update the chart instantly. Perfect for investor presentations, quarterly business reviews, and marketing strategy pitches where data-driven market insights are essential.
Usage Points
-
Main Usage
Displays year-over-year market data across three distinct categories using a stacked bar format. The magenta, navy, and lime color scheme ensures each data series is visually distinct, while the cumulative layout reveals both individual segment performance and total market composition changes over time.
-
How to Use
Deploy this slide in investor pitches, quarterly earnings presentations, and strategic planning decks to illustrate market share evolution, competitive dynamics, or revenue mix shifts. Simply enter your annual figures into the designated data cells, and the chart updates automatically to reflect your metrics.
-
Recommended For
Marketing strategists, business analysts, financial planners, and executive presenters who need to communicate multi-year market trends with clarity. Particularly effective for 3–5 year trend analysis, market segmentation studies, and competitive landscape assessments.
-
Slide Structure
Two-slide set: the first features a light background (white) with magenta, navy, and lime stacked bars; the second uses a dark background (black) with the same chart structure. Each slide includes a title area, descriptive text field, and a data input grid with four year rows and three data category columns.
Related Products
-

Oriental Herbal Medicine Analysis Graph – Visualizing Market Trends
#Market and Competitor Analysis #Graph #Industry Trends
-

Market Trend Line Comparison Analysis Chart
#Market and Competitor Analysis #Graph #Competitor Analysis
-

Horizontal Bar Chart Slide for Four-Year Change Figures
#Market and Competitor Analysis #Graph #Industry Trends
-

Marketing Performance Analysis Chart by Year – Visualizing Market Trends
#Market and Competitor Analysis #Diagram #Graph
