Brown Blue Simple Stackable Graph - Visual Data Presentation
RJ0600007_7
- Last Update 06/22/2025
- File Size 1.9MB
- # of Slides 2
- File Format PPTX
- Slide Ratio 16:9
- Color
Keywords
About the Product
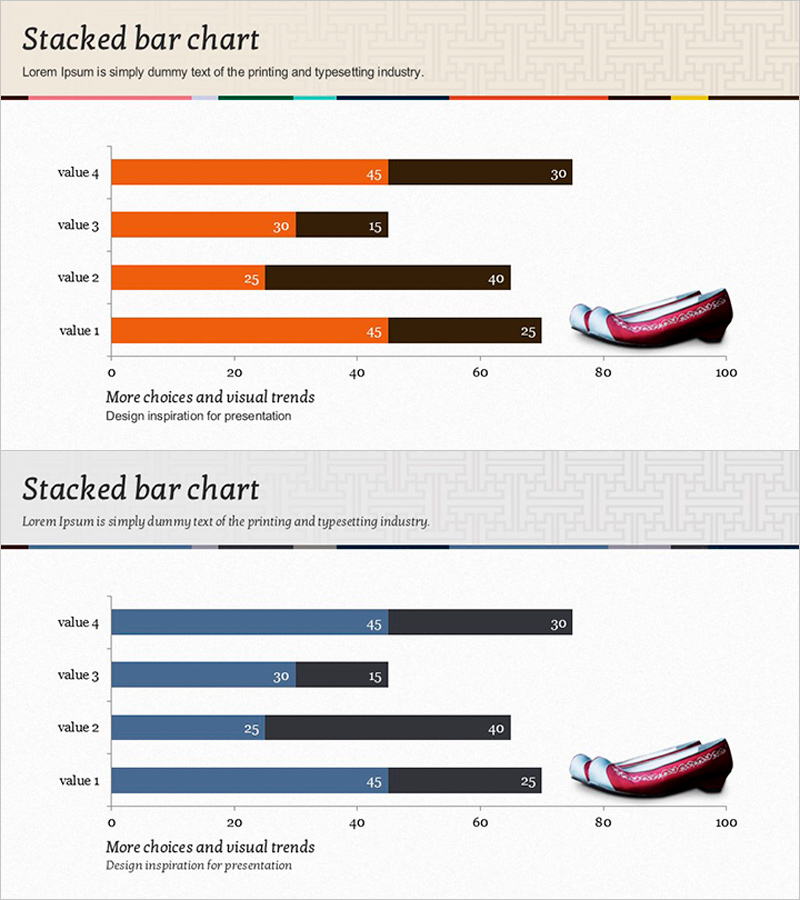
A 2-slide stacked bar chart PowerPoint template designed for multi-series data visualization. Features brown and blue color scheme with horizontal stacked bars representing 4 items (value 1-4) across 2 data series. Each bar displays values from 0-100 scale with clear numerical labels, enabling easy ratio comparison and composition analysis. The PPTX format (16:9 widescreen) is fully editable and ready for immediate use in business reports, marketing analysis, financial presentations, and performance reviews.
Usage Points
-
Main Usage
Visualizes component composition and total comparison across multiple items simultaneously. The stacked structure clearly shows each series' contribution to the whole, making it ideal for business performance, sales analysis, budget allocation, and market share representation.
-
How to Use
Input numerical values into the brown and blue bar segments to create comparative analysis materials. Both slides use identical structure for different datasets, suitable for quarterly performance comparison, regional sales analysis, product line revenue breakdown, and trend visualization.
-
Recommended For
Executive reports, quarterly performance presentations, marketing analytics, financial statements, sales analysis, budget planning meetings, and strategic planning sessions. Recommended for executives, financial analysts, marketing professionals, and data analysts requiring data-driven decision support.
-
Slide Structure
Slide 1: 4 items with brown segment (right) and blue segment (left) stacked horizontally. Slide 2: identical structure for alternative dataset. Each bar spans 0-100 scale with numerical labels and legend. 16:9 widescreen format optimized for large-screen presentations.
Related Products
-

User Analysis Graph by Age Group – Advanced Data Insights
#Market and Competitor Analysis #Diagram #Graph
-

Vertical Bar Chart Slide for Effective Data Visualization
#Market and Competitor Analysis #Graph #Competitor Analysis
-

Drone Performance Comparison Analysis Graph – Data Visualization
#Product/Service Introduction #Market and Competitor Analysis #Graph
-

Trends in Heavy Equipment Utilization – Market Analysis
#Business Introduction #Market and Competitor Analysis #Graph
