Brown Blue Simple Table – Practical Data Visualization
RJ0600007_11
- Last Update 06/22/2025
- File Size 1.9MB
- # of Slides 2
- File Format PPTX
- Slide Ratio 16:9
- Color
Keywords
About the Product
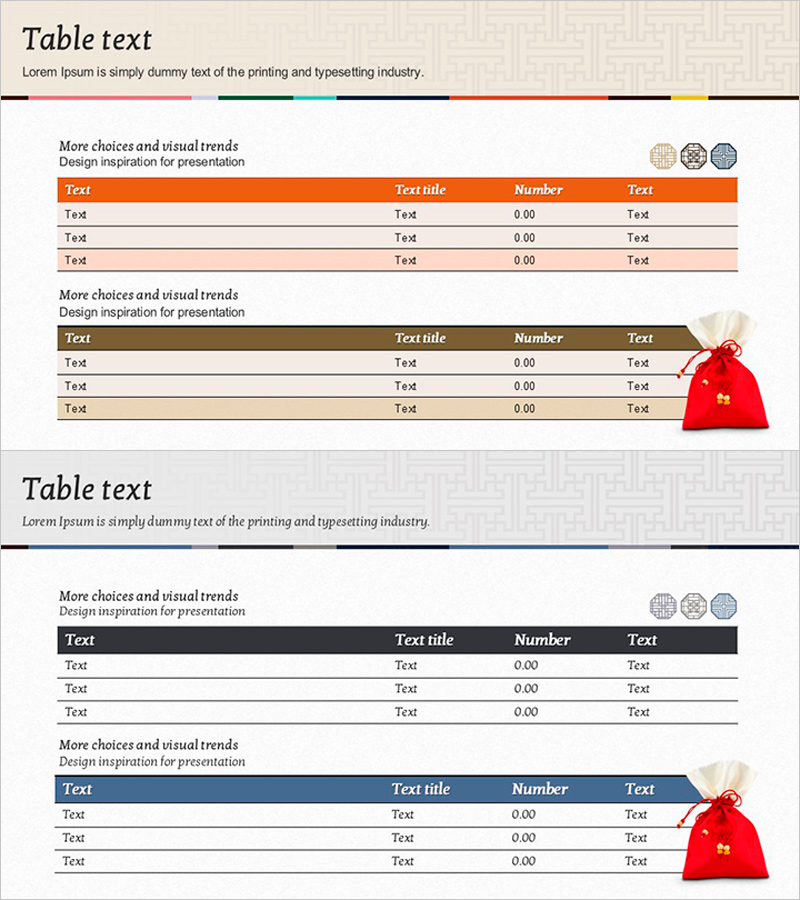
A professional table diagram PowerPoint slide featuring brown and blue dual-tone color scheme. The 2-slide deck includes 4-column data tables with highlighted header rows in orange and brown tones. Each table provides 3 rows of data entry fields, ideal for organizing sales figures, departmental performance, product comparisons, customer information, and budget summaries. Delivered in 16:9 widescreen PPTX format with fully editable cells and formatting. Ready to customize and present immediately.
Usage Points
-
Main Usage
Organize and visualize quantitative data such as sales performance, departmental results, product comparisons, customer information, and budget status in a structured row-column format. The highlighted header rows clearly distinguish categories, while light-colored data rows enhance readability and information hierarchy.
-
How to Use
Enter category names in the header cells and input numerical or text data in the data rows. Choose between the orange-header or brown-header table style based on your presentation theme. Add or remove rows as needed and adjust colors to match your corporate branding. Insert into reports, analysis documents, and comparative analysis slides.
-
Recommended For
Finance professionals, marketing teams, sales departments, project managers, and consultants who regularly present quantitative data. Suitable for quarterly performance reviews, customer analysis reports, executive briefings, team meetings, and data-driven presentations.
-
Slide Structure
2-slide deck featuring: Slide 1 – Orange-header table (4 columns × 3 data rows) with title and description area; Slide 2 – Brown-header table (4 columns × 3 data rows) with title and description area. Both slides include decorative elements (circular icons, red gift bag illustration) positioned on the right side for visual balance.
Related Products
-

IT Industry Infrastructure Connection Diagram – Business Area Overview
#Business Introduction #Diagram #Business Areas
-

Business Standard Table – Clear Visualization of Financial Performance
#Financial Plans and Performance #Diagram #Sales and Revenue
-

Strategic Business Table – Business Vision and Marketing Strategy
#Business Vision and Strategy #Marketing Plan and Strategy #Diagram
-

Interior Service Composition – Visualized with Cluster Diagram
#Product/Service Introduction #Diagram #Composition
