Gender Comparison Analysis Pairwise Bar Graph – Understanding Customers' First Step
RJ0400018_31
- Last Update 05/22/2025
- File Size 0.4MB
- # of Slides 2
- File Format PPTX
- Slide Ratio 16:9
- Color
Keywords
- #Content-Based Slides
- #Design-Based Slides
- #Market and Competitor Analysis
- #Customer Success Stories
- #Graph
- #Text Box
- #Customer Analysis
- #Customer Testimonials and Feedback
- #Horizontal Bar
- #Double Horizontal Bar
- #Speech Bubble
- #16:9
- #pairwise bar chart PowerPoint
- #gender comparison analysis slides
- #customer evaluation template
- #horizontal bar graph presentation
- #data comparison slide design
About the Product
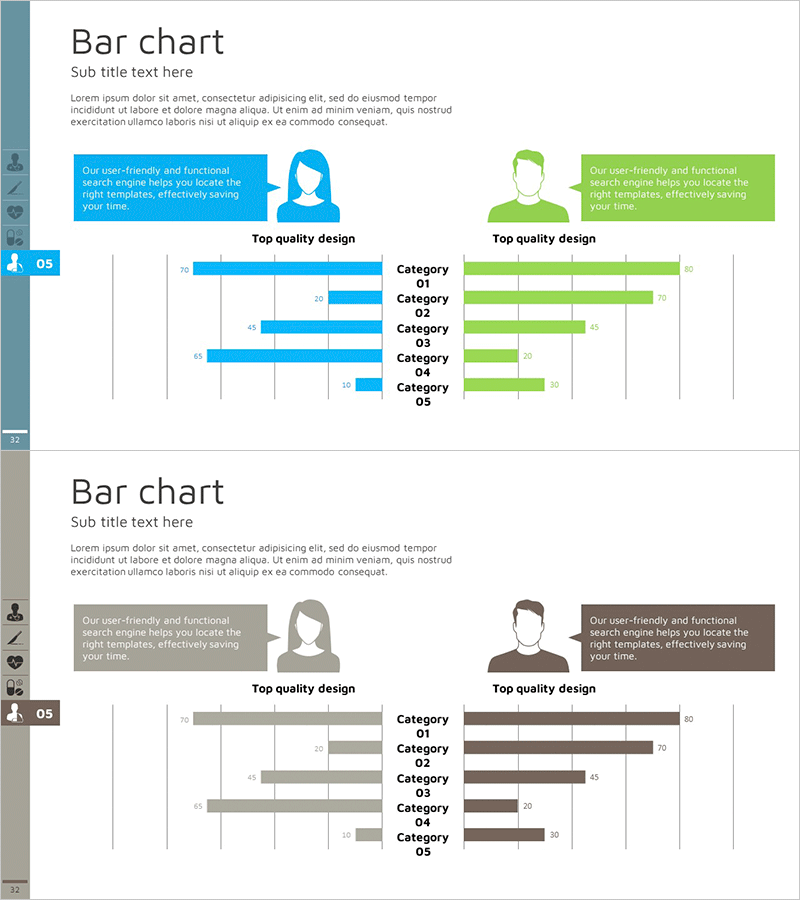
A pairwise horizontal bar chart PowerPoint slide designed for gender-based customer comparison analysis. This presentation template displays male and female data series side by side, enabling intuitive visual comparison of numerical differences across categories. The dual-color scheme—blue for male and green for female—clearly distinguishes gender segments, while numeric labels beside each bar ensure precise data readability. Ideal for visualizing gender-specific satisfaction ratings, purchase intent, brand awareness, and other customer evaluation metrics in business presentations.
Usage Points
-
Main Usage
This slide effectively presents gender-based customer metrics such as satisfaction levels, purchase intent, and brand awareness. By displaying two data series simultaneously, it enables stakeholders to identify gender-specific differences and similarities at a glance, supporting marketing strategy discussions, product development decisions, and customer segmentation analysis.
-
How to Use
Replace the five category labels (Category 01–05) and corresponding numeric values with your actual data. The blue bars represent male data and green bars represent female data; both colors and values are fully editable. Customize the title, subtitle, and descriptive text boxes to match your presentation context.
-
Recommended For
Marketing teams, product planning departments, market research analysts, and sales professionals presenting customer analysis findings. Suitable for gender-targeted strategy presentations, customer segmentation reports, product improvement proposals, and executive briefings where data credibility is essential.
-
Slide Structure
Two-slide layout, each featuring one pairwise horizontal bar chart. Blue bars (male data) and green bars (female data) are positioned side by side for five categories, with numeric labels at the bar endpoints. Avatar icons and explanatory text boxes at the top provide context and enhance visual communication.
Related Products
-

User Feedback on Medical Business Slide – Visually Clear Customer Analysis
#Market and Competitor Analysis #Customer Success Stories #Text Box
-

Customer Reviews and Feedback Slides – Stylish Customer Insights
#Market and Competitor Analysis #Customer Success Stories #Text Box
-

Slide Template Effectively Presenting Trial Conversation Content
#Market and Competitor Analysis #Customer Success Stories #Text Box
-

Participant Feedback Review Slide – Capturing Customer Voices
#Market and Competitor Analysis #Customer Success Stories #Diagram
