Business Vision Linear Graph – Visualizing Progress Plan
RJ0600002_4
- Last Update 06/21/2025
- File Size 4.5MB
- # of Slides 2
- File Format PPTX
- Slide Ratio 16:9
- Color
Keywords
- #Content-Based Slides
- #Design-Based Slides
- #Product/Service Introduction
- #Business Management
- #Diagram
- #Product and Service Overview
- #Implementation Plan
- #Flow
- #Linear Flow
- #16:9
- #linear graph PowerPoint
- #dual line chart slide
- #progress roadmap template
- #business vision diagram
- #project timeline visualization PowerPoint
About the Product
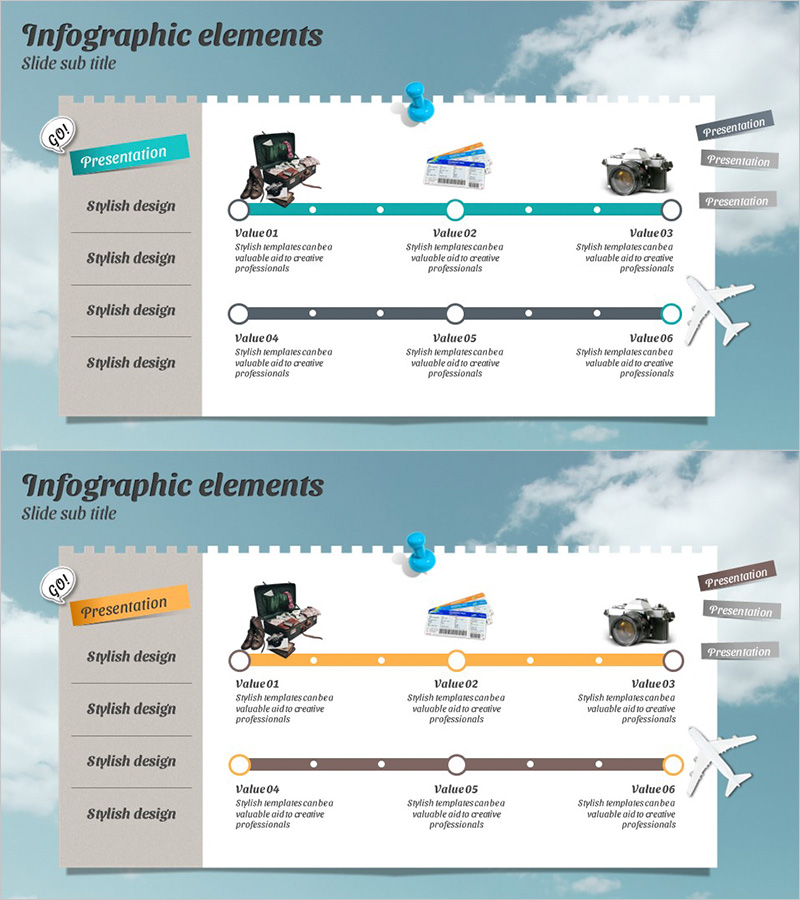
A dual-line linear graph PowerPoint slide designed to clearly present business vision and implementation roadmap. The slide features two distinct pathways in teal and gray, each containing six nodes and data points for tracking progress across stages. The left panel provides four stylish design options, while the right side includes visual elements (camera, documents, equipment) to enhance presentation impact. This structure is immediately applicable for business management reports, strategic planning presentations, and progress tracking in corporate settings.
Usage Points
-
Main Usage
This slide effectively communicates phased business strategy execution and anticipated outcomes simultaneously. The two linear pathways allow comparison of baseline versus new initiatives, or projected versus actual performance, while six nodes represent quarterly, monthly, or milestone-based checkpoints in your business roadmap.
-
How to Use
Deploy this slide in executive briefings, business planning presentations, and project status updates. Input specific targets, achievements, and timelines at each node, and use line gradient and elevation to represent growth rates and completion percentages. Add detailed explanations in the left text area to strengthen presentation persuasiveness and stakeholder engagement.
-
Recommended For
Ideal for business managers, executives, project leaders, marketing professionals, and financial analysts. Particularly effective for quarterly performance reports, annual business planning, new venture proposals, and investor pitch decks where demonstrating progress trajectory and strategic alignment is critical.
-
Slide Structure
Two-slide set featuring dual linear graphs as the core design. Each slide displays teal and gray pathways with six circular nodes positioned along each line and connected by line segments. The left panel contains four rows of text input areas for descriptions, while the right side reserves space for image insertion. Formatted in 16:9 widescreen ratio for optimal compatibility with modern presentation environments.
Related Products
-

Visualizing Business Strategy with Roadmap Diagram – Slide Featuring Marketing Plan
#Business Management #Marketing Plan and Strategy #Diagram
-

Network Firewall Service Introduction - Building a Structured Security System
#Product/Service Introduction #Diagram #Product/Service Introduction
-

Rocket Launch Plan Diagram – Business Strategy
#Business Strategy #Business Management #Diagram
-

Arrow Diagram for Project Timeline – Illuminate Project Direction
#Business Strategy #Business Management #Diagram
