Highlighting Competitive Advantage with Comparative Bifurcated Bar Chart
RJ0600001_27
- Last Update 06/21/2025
- File Size 0.2MB
- # of Slides 2
- File Format PPTX
- Slide Ratio 16:9
- Color
Keywords
- #Content-Based Slides
- #Design-Based Slides
- #Market and Competitor Analysis
- #Graph
- #Competitive Advantage
- #Horizontal Bar
- #Double Horizontal Bar
- #16:9
- #bifurcated bar chart PowerPoint
- #comparative horizontal bar graph
- #competitive analysis slide template
- #market comparison chart
- #data visualization PowerPoint slide
About the Product
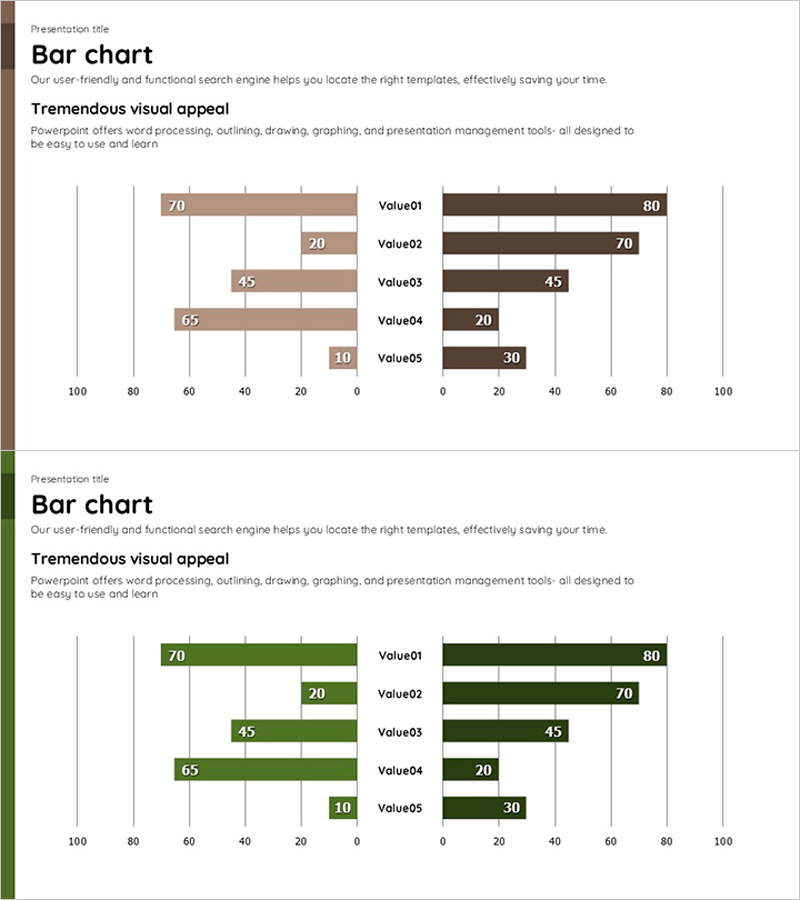
A bifurcated horizontal bar chart PowerPoint slide optimized for competitive comparison and market advantage visualization. This presentation template features five data items arranged symmetrically on left and right sides, enabling instant side-by-side comparison. Two color schemes—tan and dark green—are provided for visual distinction between competing entities. Numerical labels are clearly displayed on each bar for precise quantitative communication. The 16:9 widescreen layout ensures seamless integration into modern presentations. Ideal for business strategy decks, marketing proposals, investment pitches, and data-driven decision-making documents.
Usage Points
-
Main Usage
Quantitatively compare two competing entities (competitors, products, strategies) across five dimensions, emphasizing relative advantage through symmetric left-right layout. Numerical labels ensure precise data communication and visual impact.
-
How to Use
Apply to business strategy presentations, marketing proposals, investment pitches, and executive reports. Use in competitive analysis, product performance comparison, and market share sections. Edit bar values with your own data for immediate presentation use.
-
Recommended For
Executives, marketing managers, strategy planners, sales professionals, and consultants requiring data-driven competitive analysis. Particularly effective for B2B proposals and C-suite reporting materials.
-
Slide Structure
Two-slide set, each containing a bifurcated bar chart with five items. Left bars (tan palette) and right bars (dark green palette) are symmetrically positioned. Numerical labels appear at bar endpoints. Horizontal axis ranges 0–100 with item labels (Value01–Value05) on the center axis.
Related Products
-

Competitor Analysis and Advantage Chart – The Harmony of Blue and Red
#Market and Competitor Analysis #Graph #Competitor Analysis
-

Company Two-Way Horizontal Bar Graph – Competitive Advantage Analysis
#Market and Competitor Analysis #Graph #Market Status
-

Competitor Product Analysis and Competitive Advantage Bar Chart – Market Share Comparison
#Market and Competitor Analysis #Graph #Competitor Analysis
-

Blue Red Two-way Graph – Highlighting Competitive Advantage
#Business Strategy #Market and Competitor Analysis #Graph
