Content-Based and Customer Analysis Presentation Template – Sleek Design with Clear Layouts
RJ0500051_4
- Last Update 06/21/2025
- File Size 1MB
- # of Slides 6
- File Format PPTX
- Slide Ratio 16:9
- Color
Keywords
About the Product
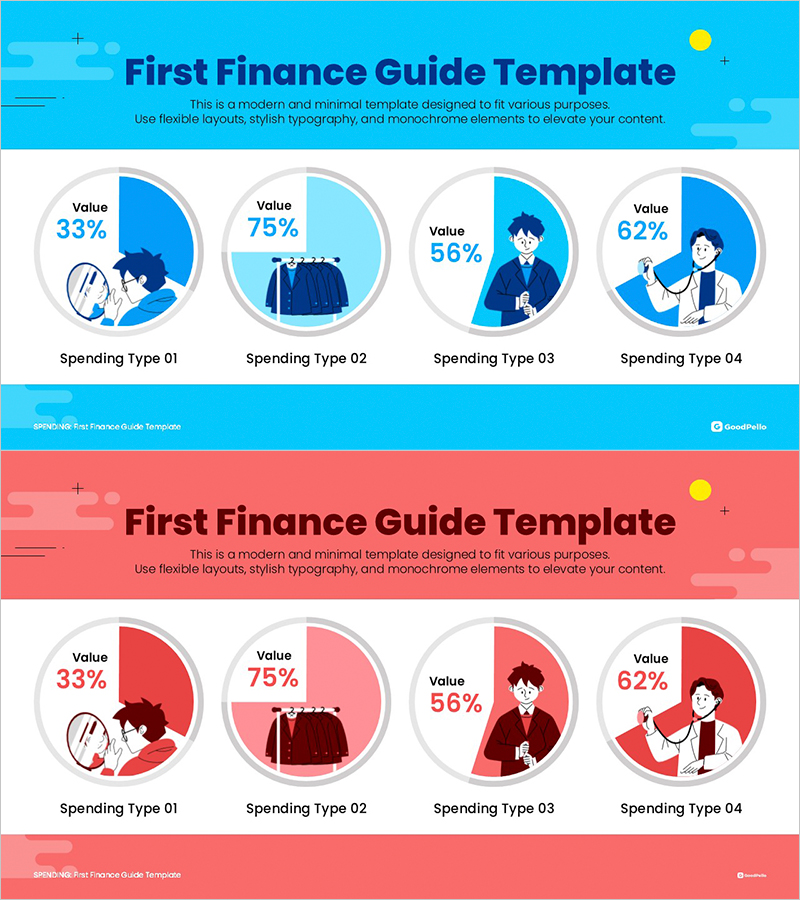
A PowerPoint slide set visualizing customer spending types through four pie charts with distinct color schemes. Each chart displays specific percentages (33%, 75%, 56%, 62%) in circular graph format, available in both blue and red color versions. Illustrated characters accompany each spending category description, making the slides ready for immediate presentation use. Provided as 6-slide 16:9 ratio PPTX format with full editing capability, ideal for financial reports, marketing analysis, and customer segmentation presentations.
Usage Points
-
Main Usage
Optimized for clearly expressing customer spending patterns, consumption types, and ratio analysis through circular graphs. Each pie chart represents an independent spending category, with numbers and visuals presented together to enhance audience comprehension.
-
How to Use
Use in financial analysis presentations, marketing strategy meetings, customer segmentation reports, and quarterly performance briefings to explain spending composition ratios. Apply blue version for situations requiring credibility and professionalism, and red version for content requiring emphasis or caution.
-
Recommended For
Recommended for finance teams, marketing departments, sales teams, and executives preparing presentation materials. Particularly useful for customer behavior analysis, budget allocation explanations, market share comparisons, and consumer preference survey result presentations.
-
Slide Structure
Four slides each contain an independent pie chart composed of a gray-bordered circular shape with color segments (blue or red palette) and numerical labels inside. Spending type labels (01-04) are positioned below each chart, with illustrated characters reinforcing the meaning of each visualization.
Related Products
-

Drug Addiction Gender Ratio Analysis Graph - Customer Analysis
#Market and Competitor Analysis #Graph #Other
-

Customer and Market Share Analysis Pie Chart Slide
#Market and Competitor Analysis #Graph #Customer Analysis
-

Space Industry Analysis Graph Chart – Market and Competitive Analysis
#Market and Competitor Analysis #Graph #Customer Analysis
-

Toys and Pie Chart Analysis – Visual Data for Customer Insights
#Market and Competitor Analysis #Graph #Customer Analysis
