Core KPIs for Enhancing Presentation Performance – Measuring Work Outcomes
RJ0500050_5
- Last Update 06/21/2025
- File Size 0.9MB
- # of Slides 2
- File Format PPTX
- Slide Ratio 16:9
- Color
Keywords
About the Product
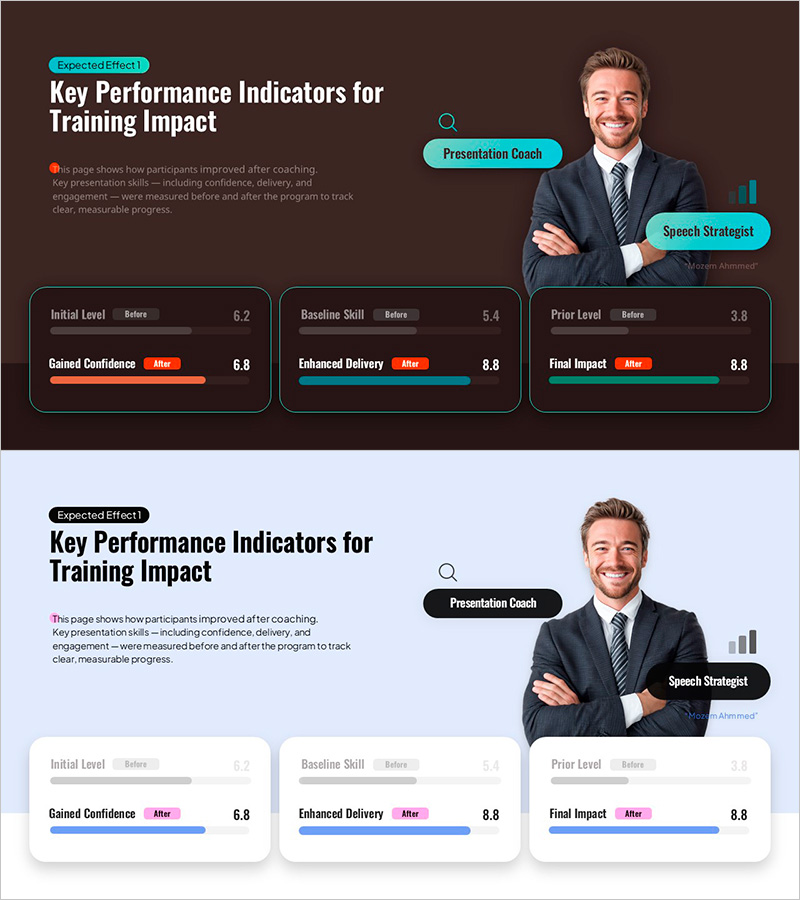
A comprehensive KPI performance measurement slide set designed to enhance presentation impact. This 2-slide PowerPoint template features a dark brown background with turquoise accent elements, presenting three measurement stages: initial level, baseline skill, and final impact. Each stage includes dedicated data input areas and gauge charts to visualize key metrics such as gained confidence, enhanced delivery, and final impact. The structured comparison layout enables clear before-and-after analysis for training outcomes, coaching results, and presentation effectiveness. Ideal for business strategy presentations, educational program reports, performance reviews, and stakeholder communications requiring quantitative impact measurement.
Usage Points
-
Main Usage
This slide quantifies and visualizes training program outcomes through a three-stage comparison framework. It demonstrates measurable improvement from initial level through baseline skill to final impact, providing clear evidence of educational effectiveness, coaching results, and presentation skill enhancement. Perfect for communicating program value to executives, investors, and stakeholders through data-driven insights.
-
How to Use
Input before-and-after metrics in the designated data fields for each stage, then update the gauge chart values and colors to match your measurements. Customize metric labels (confidence, delivery, impact) to align with your specific program objectives. Insert into business reports, training evaluation presentations, or performance review documents. All elements are fully editable for color, text, and numerical values.
-
Recommended For
HR professionals, training directors, presentation coaches, business consultants, and performance managers. Suitable for training program evaluations, coaching outcome reports, presentation skills assessments, business strategy performance analysis, and stakeholder impact communications requiring quantitative measurement and visual comparison.
-
Slide Structure
Two-slide set with horizontally arranged 3-stage comparison layout. Each stage contains before-and-after data input fields and corresponding gauge charts with turquoise accent bars for visual impact. The first slide presents the primary comparison framework, while the second slide offers a color-variant version for flexibility. All elements support direct data entry and chart updates without design modification.
Related Products
-

Spot Multidirectional Diagram – Visualizing Business Strategies
#Product/Service Introduction #Business Strategy #Diagram
-

Tooth Sugar Increase Decrease Diagram – Profitability and Expected Effects
#Business Strategy #Diagram #Graph
-

Contrast Highlight Customer Analysis Chart - Strategic Analysis for Competitors
#Business Strategy #Market and Competitor Analysis #Diagram
-

Product Sales Status Chart – Effective Data Visualization
#Business Strategy #Market and Competitor Analysis #Diagram
