Donut Chart with Children in the Water
RJ0500046_7
- Last Update 06/20/2025
- File Size 0.2MB
- # of Slides 2
- File Format PPTX
- Slide Ratio 16:9
- Color
Keywords
About the Product
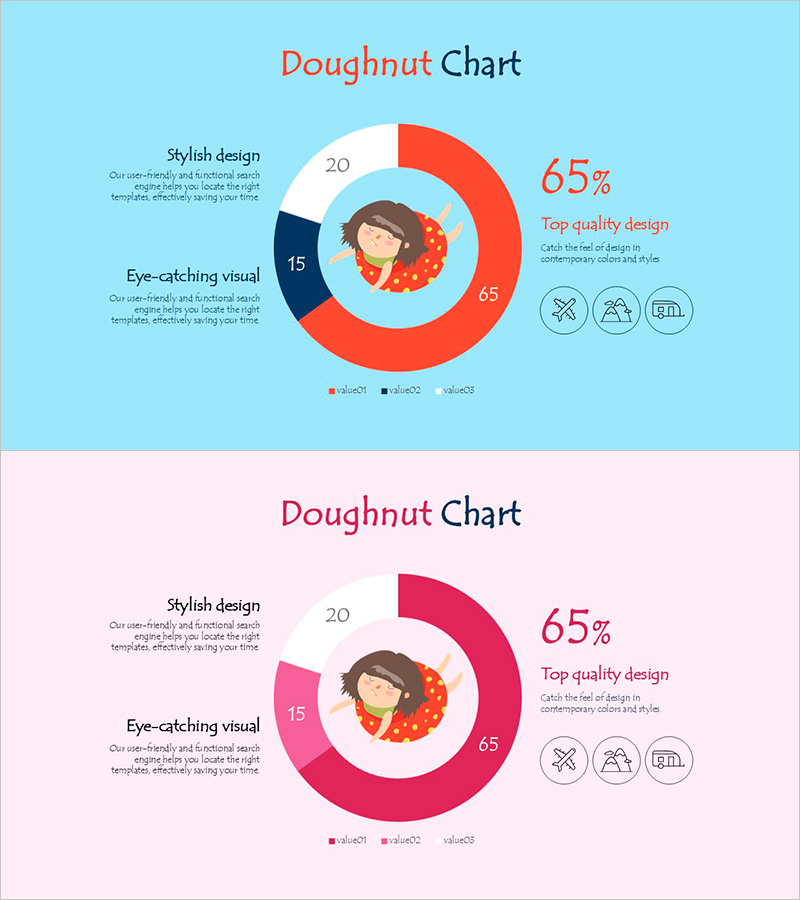
A PowerPoint slide featuring a 3-segment donut chart displayed on light sky blue and pink backgrounds. The design places a child illustration at the center to enhance visual appeal, with descriptive text on the left and percentage values on the right, creating a well-balanced layout. The 2-slide set uses contrasting background colors to provide presentation variety. This donut chart slide effectively visualizes ratio data such as market share, sales distribution, and customer satisfaction, making it immediately applicable to marketing reports and business analysis presentations.
Usage Points
-
Main Usage
The donut chart clearly expresses the proportion of each item relative to the whole. Combined with the center illustration, it captures audience attention while the left descriptive text and right numerical display maximize information delivery efficiency. Ideal for marketing performance analysis, market share reporting, and customer segmentation visualization.
-
How to Use
The 2-slide set features different background colors (sky blue and pink) for section differentiation or comparative analysis. Edit the donut chart values and legend with your own data, and modify the left descriptive text to match your presentation context for immediate use. The illustration can be retained or removed to adjust the formality level of your presentation.
-
Recommended For
Recommended for marketing teams presenting campaign performance analysis, sales teams reporting regional and customer segment distribution, executive-level business analysis presentations, and market research result sharing. Applicable to all roles handling ratio-based data in reports and planning presentations.
-
Slide Structure
Each slide comprises a 3-segment donut chart (20%, 15%, 65% distribution), a centered child illustration, two descriptive text items on the left, key percentage value (65%) and three icons on the right, with a legend at the bottom clearly indicating data segments.
Related Products
-

Avocado Share Chart – Market Status and Competitive Analysis
#Market and Competitor Analysis #Graph #Other
-

Causes of Fire Donut Chart – Visualizing Market Analysis
#Market and Competitor Analysis #Graph #Market Share
-

Beer Carbonated Doughnut Chart – Market Share Analysis
#Market and Competitor Analysis #Financial Plans and Performance #Graph
-

Analyzing Market Share with Donut Chart – Clean and Stylish Design
#Company Introduction #Market and Competitor Analysis #Graph
