World Map and Parasol Display – Market Analysis and Investment Revenue Forecast
RJ0500046_25
- Last Update 06/20/2025
- File Size 0.6MB
- # of Slides 2
- File Format PPTX
- Slide Ratio 16:9
- Color
Keywords
- #Content-Based Slides
- #Design-Based Slides
- #Market and Competitor Analysis
- #Financial Plans and Performance
- #Other
- #Market Analysis
- #Projected Return on Investment (ROI)
- #Map
- #16:9
- #world map PowerPoint slide
- #map design template
- #global market analysis slide
- #investment ROI visualization
- #geographic data presentation
About the Product
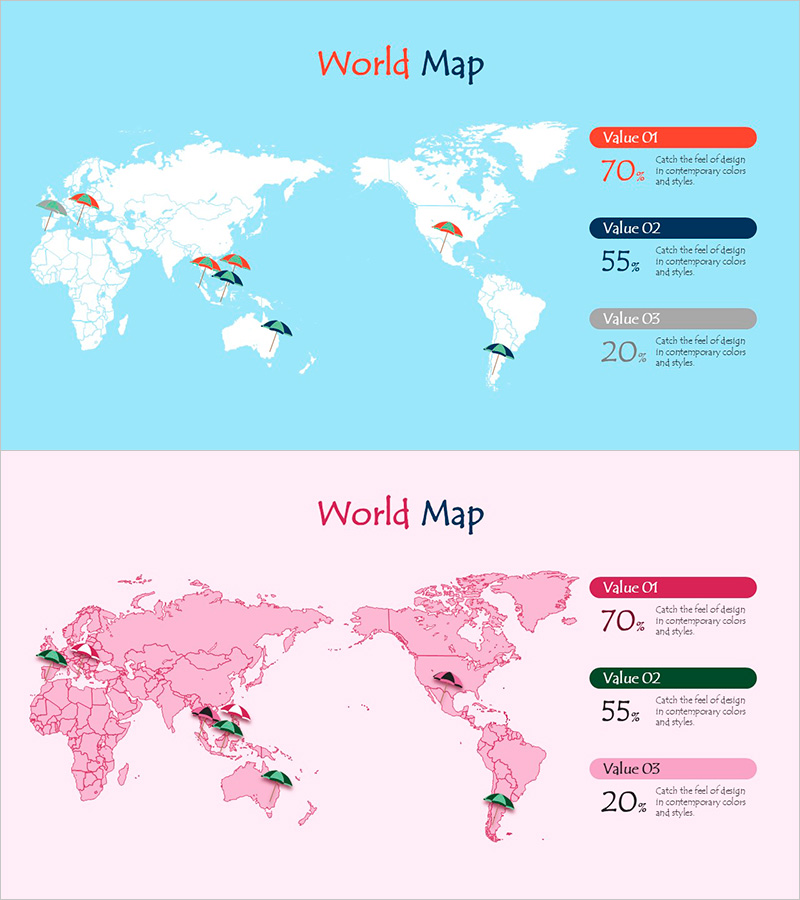
A professional world map PowerPoint slide designed for global market analysis and investment revenue forecasting. Available in two background colors—light blue and pink—this slide features parasol icons positioned across continents to mark regional data points. The right side includes three value input areas (Value 01, 02, 03) for displaying key metrics such as market share, ROI, or growth rates side by side. Ideal for presenting international business performance, global expansion strategies, investor presentations, and financial reports requiring geographic data visualization.
Usage Points
-
Main Usage
Visualize country-by-country business performance, global market share, and investment returns on a world map to support strategic decision-making. The parasol markers and right-side value fields enable simultaneous comparison of multiple metrics, making it ideal for investor pitches, executive briefings, and market analysis reports.
-
How to Use
Select regions on the world map by clicking parasol positions, then enter corresponding data values (market share, ROI, growth rate) in the Value 01, 02, and 03 fields on the right. Choose between light blue or pink background based on your corporate branding and presentation theme, then customize text and numbers as needed.
-
Recommended For
Global enterprises presenting to executives and investors, international market entry strategy meetings, quarterly and annual financial reports' market analysis sections, venture capital pitch decks, and consulting firms' market research presentations.
-
Slide Structure
Each slide features a centered 'World Map' title at the top, a detailed world map with country borders in the center, 4–5 parasol icons positioned across continents, and three labeled value input areas (Value 01 in red, Value 02 in dark blue, Value 03 in gray) on the right side. Both slides share identical layouts with only background color variation.
Related Products
-

Leather Material Presentation Template Column Chart
#Market and Competitor Analysis #Graph #Other
-

Business Forest Wide Template Map3 - Market and Competitive Analysis
#Market and Competitor Analysis #Marketing Plan and Strategy #Other
-

Business Forest Wide Template Europe Map – A New Horizon for Market Analysis
#Market and Competitor Analysis #Financial Plans and Performance #Diagram
-

Global Target Market Analysis Graph
#Market and Competitor Analysis #Diagram #Graph
