Science and Technology Observation Target Market – Market Analysis Slide
RJ0500048_17
- Last Update 06/20/2025
- File Size 0.5MB
- # of Slides 2
- File Format PPTX
- Slide Ratio 16:9
- Color
Keywords
About the Product
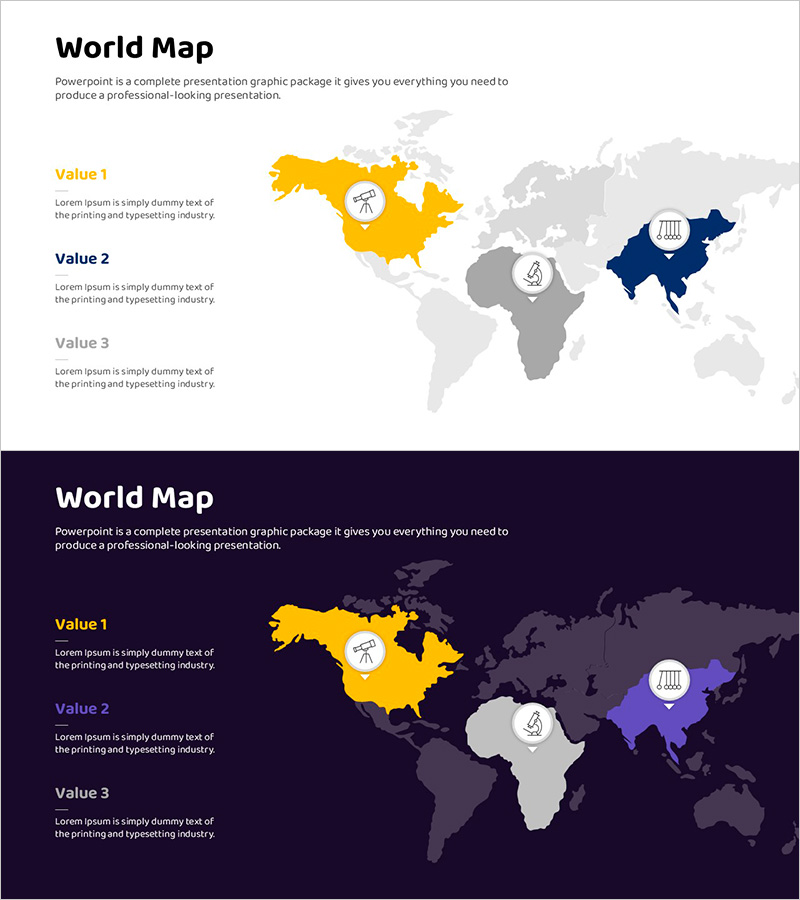
A professional PowerPoint slide for visualizing global market analysis and region-specific target market strategies. Provided in two versions with light and dark backgrounds, featuring three highlighted regions in yellow, gray, and navy blue for easy comparison. Each region includes icons to intuitively represent key elements such as industry, technology, and infrastructure. With three text input areas for Value 1, 2, and 3 descriptions, you can effectively communicate competitive analysis, market share, and region-specific growth strategies. Available in 16:9 widescreen PPTX format, ready for immediate editing and customization.
Usage Points
-
Main Usage
Ideal for presentations analyzing and comparing global market conditions by region. The world map with highlighted regions and icons enables stakeholders to quickly grasp each market's characteristics and opportunities, building credibility when presenting to investors, partners, and executives.
-
How to Use
Fill in the Value 1, 2, and 3 text areas on the left side of the slide with each region's market size, growth rate, competitive intensity, and market entry strategy. Use the light background version for internal meetings and training, and the dark background for external presentations and investment pitches.
-
Recommended For
Business development teams, marketing strategists, investment managers, international expansion specialists, and executive report creators. Particularly suitable for science and technology, IT, and manufacturing companies planning global market expansion and strategic presentations.
-
Slide Structure
Two-slide composition. Slide 1 features a light background with world map and three highlighted regions; Slide 2 is the dark background version. Each slide includes one title area, three text description areas, and three region-specific icons, creating a clear information hierarchy.
Related Products
-

Target Country Year-by-Year Analysis Chart – Data Visualization for Market Analysis
#Market and Competitor Analysis #Graph #Other
-

Household Survey by Region Slide – Visualizing Market Analysis Template
#Market and Competitor Analysis #Other #Market Analysis
-

Botanic Garden Wide PPT Map – A Visual Tool for Effective Market Analysis
#Market and Competitor Analysis #Diagram #Other
-

Asian Target Market Analysis Graph
#Market and Competitor Analysis #Graph #Other
