Doughnut Chart Data Visualization Slide – Top Quality Design
RJ0500045_10
- Last Update 06/19/2025
- File Size 0.7MB
- # of Slides 2
- File Format PPTX
- Slide Ratio 16:9
- Color
Keywords
About the Product
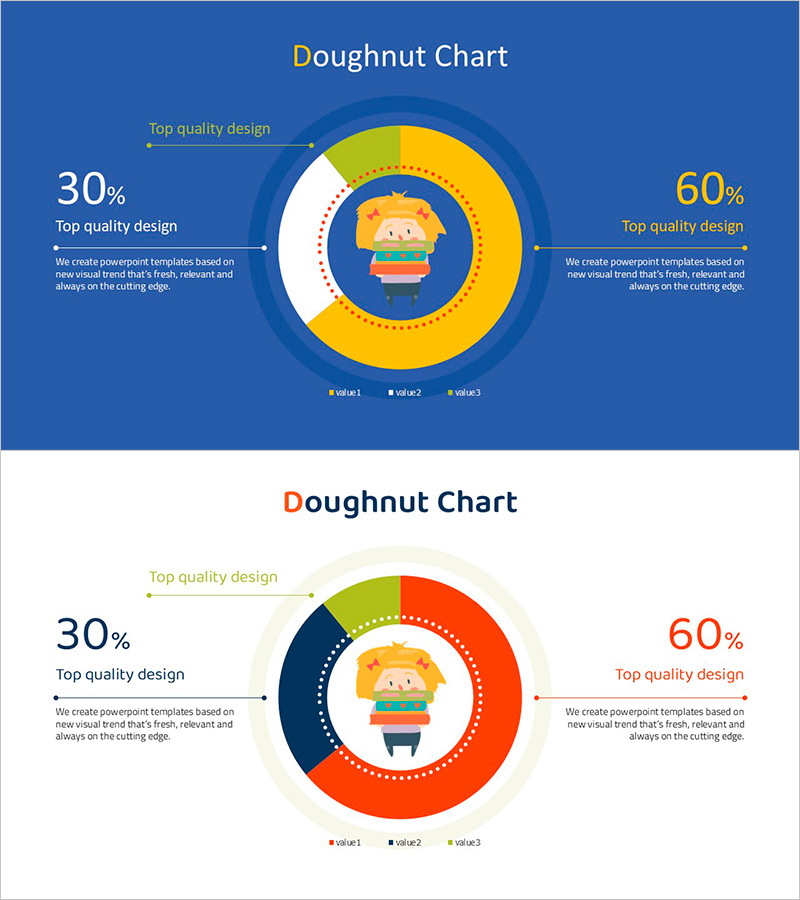
A 2-slide PowerPoint presentation featuring doughnut charts for data visualization. Each slide displays a central illustration icon surrounded by a three-segment doughnut ring that represents proportional data with percentage values and descriptive text. Two design versions are provided: a dark blue background and a light background, each with different color combinations (blue-yellow-white and red-navy-green) to suit various presentation contexts. Delivered in 16:9 widescreen PPTX format with fully editable elements. Ideal for presenting market share, performance metrics, customer satisfaction, budget allocation, and other ratio-based data in business reports, investor presentations, and strategic meetings.
Usage Points
-
Main Usage
Visualize proportional data intuitively using doughnut chart slides. The central illustration icon emphasizes the topic while the three-segment outer ring clearly displays percentage values for each category. Perfect for presenting market composition, performance distribution, customer segmentation, budget breakdown, and other ratio-based information in professional presentations.
-
How to Use
Use the dark blue background version for formal corporate reports and official presentations, and the light background version for educational materials and casual presentations. Replace the percentage values and legend with your actual data, and swap the central icon with an image relevant to your topic. Adjust the color scheme to match your company branding or presentation theme.
-
Recommended For
Marketing professionals, financial analysts, business planners, consultants, and educators presenting market analysis, performance reports, budget status, customer composition, and strategic insights. Suitable for quarterly earnings presentations, investor briefings, strategy meetings, training seminars, and corporate communications.
-
Slide Structure
Each slide contains a title area, a central circular icon, a three-segment doughnut chart, percentage values displayed on both left and right sides (30%, 60%, etc.), descriptive text for each segment, and a legend at the bottom. Both slides share identical layouts with only background color variations.
Related Products
-

Market Share Global Map – Real-Time Data for Market Analysis
#Market and Competitor Analysis #Graph #Market Share
-

Red Sky Donut Chart – Market Share Analysis
#Company Introduction #Market and Competitor Analysis #Graph
-

Visualizing Market Share with Watercolor Donut Chart
#Market and Competitor Analysis #Graph #Market Share
-

Visualizing Major Plant Composition with Donut Chart
#Product/Service Introduction #Market and Competitor Analysis #Graph
