Online Education Donut Chart - Visualizing Market Share
RJ0500041_6
- Last Update 06/18/2025
- File Size 0.2MB
- # of Slides 2
- File Format PPTX
- Slide Ratio 16:9
- Color
Keywords
- #Content-Based Slides
- #Design-Based Slides
- #Market and Competitor Analysis
- #Graph
- #Market Share
- #Circles
- #Doughnut Chart
- #16:9
- #donut chart PowerPoint
- #pie chart slide template
- #market share visualization
- #ratio comparison slide
- #4-segment donut graph
- #data visualization PPT
- #percentage chart download
About the Product
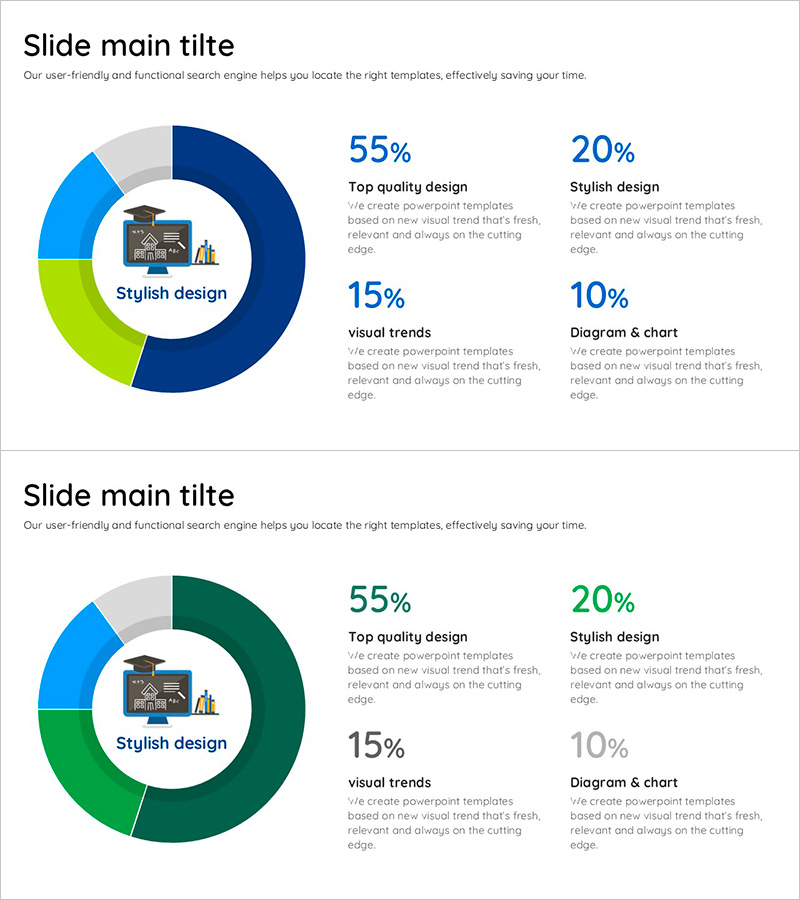
A 4-segment donut chart PowerPoint slide designed to visualize online education market share and proportional data. The donut graph features dark blue, light blue, lime green, and gray segments representing percentages (55%, 20%, 15%, 10%) with clear visual distinction. The layout includes a central icon area for emphasizing key messages, with legend and descriptive text positioned on the right side for comprehensive information delivery. Comprising 2 slides optimized for 16:9 widescreen format, this presentation template is ready to use in business reports, proposals, and pitch decks for comparing data and explaining compositional ratios across various industries.
Usage Points
-
Main Usage
Ideal for presenting online education market share, product sales ratios, customer composition, budget allocation, and market segmentation. The central icon area allows you to emphasize key themes or categories, making it perfect for executive presentations and strategic analysis reports.
-
How to Use
Simply replace the displayed percentages and legend text with your actual data values. Adjust the donut chart segment colors and sizes to reflect your data, then input detailed information for each item in the right-side description area. The central icon can be customized to match your topic or brand.
-
Recommended For
Marketing managers, business analysts, strategists, and executives presenting market analysis, business performance, customer distribution, and budget allocation. Applicable across industries including online education, e-commerce, SaaS, finance, and retail for business presentations, reports, and proposals.
-
Slide Structure
2-slide set featuring 4-segment donut charts (dark blue, light blue, lime green, gray) with central icon placement and right-aligned legend and descriptive text. First slide emphasizes dark blue tones while second slide features dark green tones, providing design flexibility for multiple data presentations.
Related Products
-

Bottled Beer Donut Chart – Market Share Visualization
#Market and Competitor Analysis #Marketing Plan and Strategy #Graph
-

Analyzing Market Share with Donut Chart – Clean and Stylish Design
#Company Introduction #Market and Competitor Analysis #Graph
-

Watercolor Customer Analysis Donut Chart – Visualizing Market Share
#Market and Competitor Analysis #Graph #Market Share
-

Red Sky Donut Chart – Market Share Analysis
#Company Introduction #Market and Competitor Analysis #Graph
