Red Purple Highlight Vertical Bar Chart - Visual Insights
RJ0500040_8
- Last Update 06/18/2025
- File Size 0.1MB
- # of Slides 2
- File Format PPTX
- Slide Ratio 16:9
- Color
Keywords
About the Product
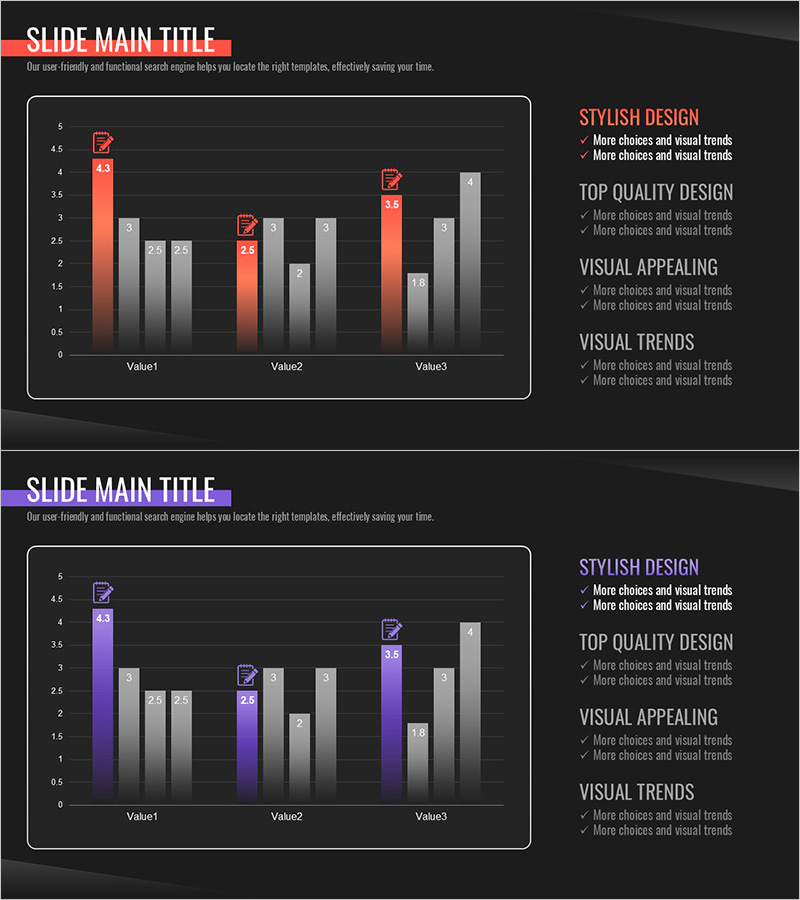
A professional vertical bar chart PowerPoint slide optimized for business analysis and data visualization. Red and purple accent colors emphasize key data points, enabling clear comparison of three data series at a glance. Designed with a dark background, explicit value labels, and clean typography for immediate presentation use. Ideal for sales comparisons, performance metrics, and quarterly reports. The template includes 2 slides in 16:9 widescreen PPTX format, ready for customization with your own data.
Usage Points
-
Main Usage
Compares three or more data series using vertical bars, making relative magnitudes and trends immediately visible. Perfect for quarterly revenue, departmental performance, product sales volume, and other numerical comparisons. Red and purple highlights draw attention to critical metrics and insights.
-
How to Use
Replace bar heights with your actual data values and update axis labels and legend text to match your presentation context. The dark background and clear value labels ensure readability even in large conference rooms. Duplicate bar groups to add additional data series if needed.
-
Recommended For
Finance, sales, and marketing teams presenting quarterly or monthly performance reports. Suitable for product line comparisons, regional sales analysis, channel performance reviews, executive briefings, investor presentations, and team meetings.
-
Slide Structure
2-slide template. Each slide displays a vertical bar chart with 3 data series (Value1, Value2, Value3) color-coded in red, purple, and gray. Y-axis ranges from 0 to 6 with labeled data points. Right panel includes 4 text input areas for supporting commentary and insights.
Related Products
-

Donut Chart for Market Share Analysis Slide
#Market and Competitor Analysis #Graph #Market Status
-

(Orange & Green) Bundle Chart and Future Outlook
#Business Strategy #Financial Plans and Performance #Graph
-

Travel Guide Industry Competitor Analysis Vertical Bar Chart
#Market and Competitor Analysis #Graph #Competitor Analysis
-

Project Key Performance Charts – Highlighting Core Achievements
#Company Introduction #Graph #Company Overview
