Digital Learning Icons and Child's Interview Slide
RJ0500039_23
- Last Update 06/17/2025
- File Size 2.7MB
- # of Slides 2
- File Format PPTX
- Slide Ratio 16:9
- Color
Keywords
- #Content-Based Slides
- #Design-Based Slides
- #Product/Service Introduction
- #Customer Success Stories
- #Diagram
- #Features
- #Customer Cases and Success Stories
- #Cluster
- #Closed Cluster Diagram
- #16:9
- #cluster diagram PowerPoint
- #icon slide template
- #digital learning presentation
- #12-icon layout
- #educational outcome visualization
- #diagram slide design
About the Product
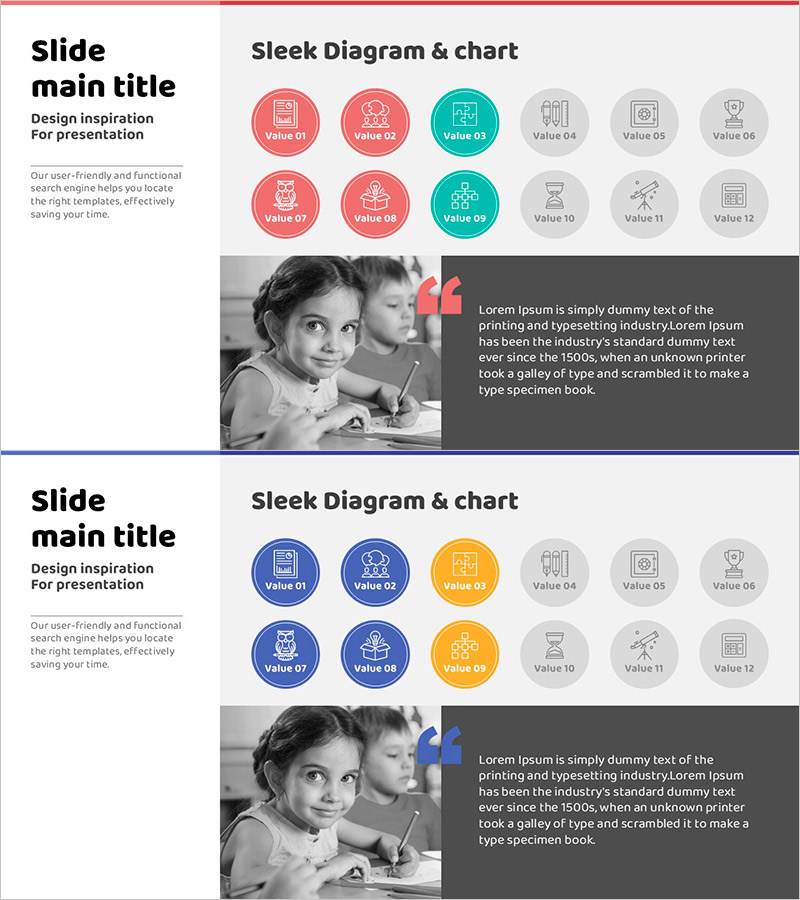
A 12-icon cluster diagram PowerPoint slide that visualizes digital learning and educational outcomes. Circular icons in red, teal, and gray are arranged around a central concept, each representing learning value, collaboration, technology, and success. The 2-slide set features a cluster diagram on the first slide and a real-world case study layout combining student photo and text area on the second. Instantly applicable for educational institutions, learning platforms, and success case presentations.
Usage Points
-
Main Usage
Visualizes diverse values and impacts of digital learning at a glance. Twelve icons radiate from a central concept, clearly expressing ecosystem components and interdependencies. Ideal for educational institutions presenting learning outcomes, online platforms showcasing features, and digital transformation strategy presentations.
-
How to Use
Input category names into the 12-icon cluster on slide 1 to define learning domain values. On slide 2, add learner photos and concrete case descriptions or achievement data. Leverage color coding (red=core, teal=key features, gray=supporting) to emphasize information hierarchy and guide audience focus.
-
Recommended For
Education ministry officials, university administrators, online learning platform managers, EdTech marketing teams, education innovation project leaders, and learning outcome report writers. Suitable for student interviews, success case sharing, and educational program introduction slides.
-
Slide Structure
2-slide set. Slide 1: Central text surrounded by 12 circular icons in 2×6 grid cluster diagram. Color-coded: red (Value 01, 07, 08), teal (Value 03, 09, 10), gray (Value 04, 05, 06, 11, 12). Slide 2: Left side black-and-white photo area, right side dark background text section, red accent mark at top.
Related Products
-

Ringer Shape Subdivided Column Graph for Program Introduction – Clustered Data Visualization
#Product/Service Introduction #Diagram #Features
-

Square Rounding Text Box – Optimized for Product and Service Presentation
#Product/Service Introduction #Operational Plan #Diagram
-

Modern Business Presentation Template
#Product/Service Introduction #Diagram #Features
-

Target Behavior Analysis: Children and Seniors Slide
#Product/Service Introduction #Market and Competitor Analysis #Diagram
