Key Keyword Diagram – Providing Business Insights
RB0800002_9
- Last Update 03/17/2025
- File Size 0.1MB
- # of Slides 2
- File Format PPTX
- Slide Ratio 4:3
- Color
Keywords
- #Content-Based Slides
- #Design-Based Slides
- #Product/Service Introduction
- #Business Management
- #Diagram
- #Features
- #Implementation Plan
- #Cluster
- #Closed Cluster Diagram
- #4:3
- #central emphasis diagram PowerPoint
- #4-node diagram slide template
- #business insights presentation
- #key point diagram
- #how to create diagram in PowerPoint
About the Product
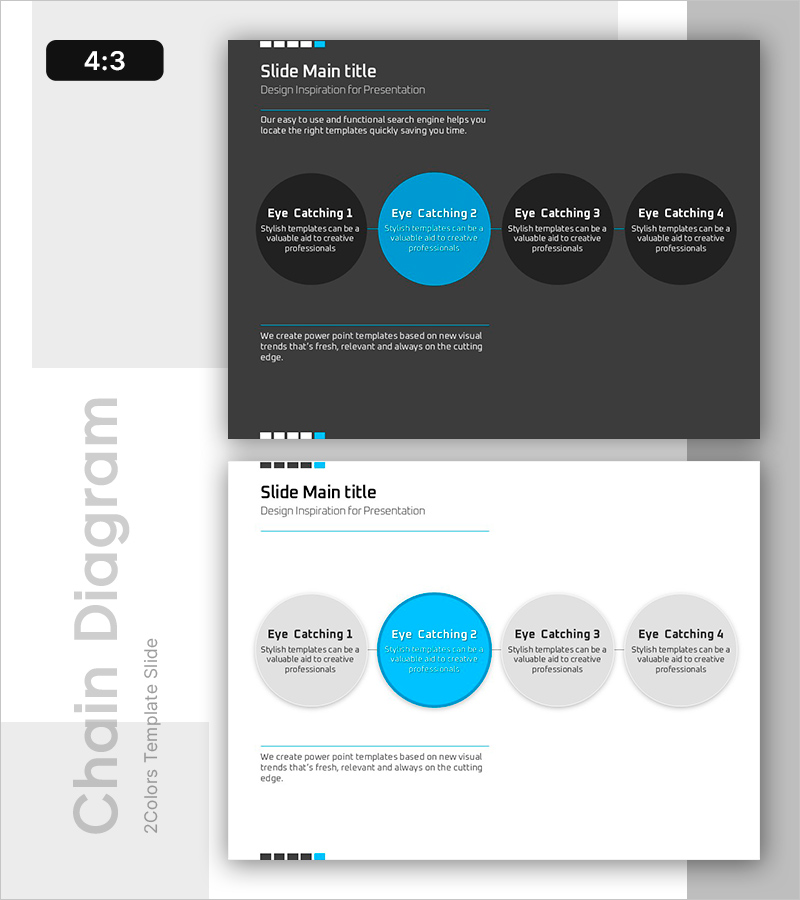
A central emphasis diagram PowerPoint slide that visualizes key messages across 4 nodes with a prominent blue accent on a dark gray background. Each node provides independent text areas, making it ideal for presenting business insights, core values, strategic points, and key concepts. The 2-slide set includes both dark and light theme layouts, allowing you to choose the design that best fits your presentation context and background. Fully editable PPTX format for immediate customization.
Usage Points
-
Main Usage
Effectively highlights core concepts or strategies by organizing them into 4 key items, drawing audience attention to the central message. The central node clarifies the main topic while surrounding nodes provide supporting details, creating a clear information hierarchy.
-
How to Use
Simply input your key terms or descriptions into each node's text area. Use the dark theme (first slide) for executive presentations requiring a professional atmosphere, and the light theme (second slide) for educational seminars and training sessions.
-
Recommended For
Ideal for business strategy presentations, marketing planning, organizational restructuring, product launches, and performance analysis. Recommended for executives, planning teams, marketing departments, consultants, and business professionals who need to emphasize key points.
-
Slide Structure
2-slide set with identical layouts in different color schemes. Each slide features 1 central blue circular node surrounded by 3 gray circular nodes, connected by lines to show relationships. First slide uses dark gray background; second slide uses white background.
Related Products
-

Mobile System Characteristics Configuration Diagram – Visualization of Service Operation Plans
#Product/Service Introduction #Business Management #Technical Approach
-

Body Fat Type Analysis Slide – Cluster Diagram
#Product/Service Introduction #Market and Competitor Analysis #Diagram
-

Characteristics of Industrial Tools – Effective Product Presentation Slide
#Product/Service Introduction #Diagram #Product/Service Introduction
-

Bookmark Box Diagram – Product and Service Introduction
#Product/Service Introduction #Operational Plan #Diagram
