Parallelogram Properties Text – Visualization in Technology Sector
RJ0500036_6
- Last Update 06/17/2025
- File Size 0.5MB
- # of Slides 2
- File Format PPTX
- Slide Ratio 16:9
- Color
Keywords
About the Product
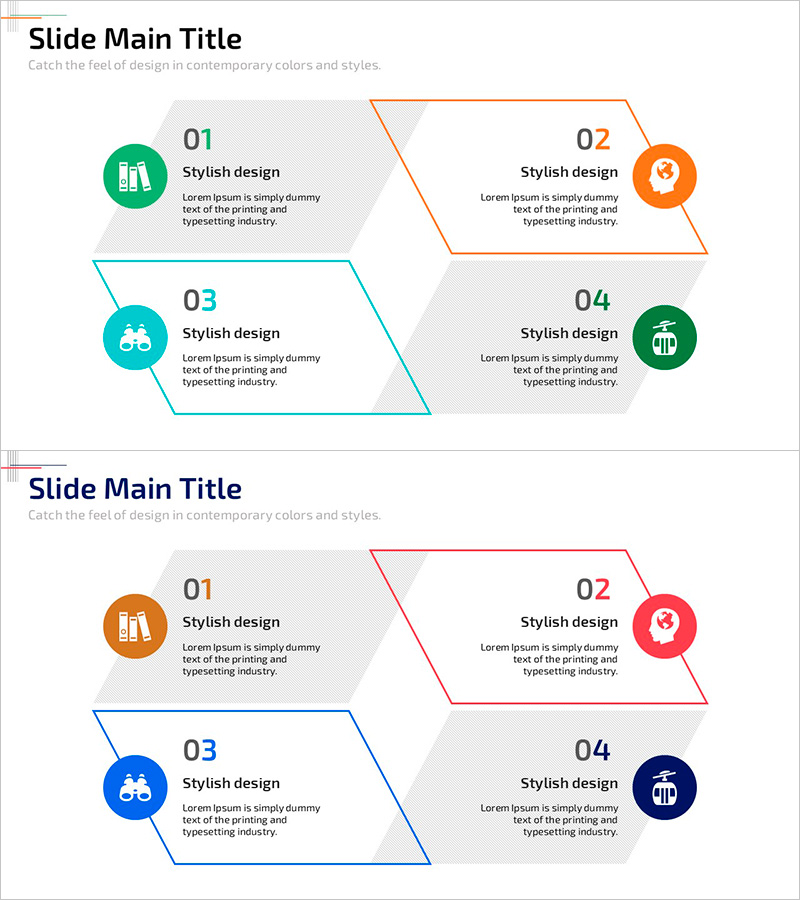
A multicolor parallelogram diagram PowerPoint slide optimized for technology sector and business process visualization. Four circular icons in green, orange, cyan, and dark green coordinate with parallelogram text boxes, clearly separating title and description areas for each item. The 2-slide set in 16:9 widescreen format is ready to use in diverse presentation scenarios, effectively visualizing technology systems, organizational structures, process stages, and key functions. All text and shapes are fully editable, allowing you to customize colors, icons, and content freely.
Usage Points
-
Main Usage
Presents and compares four items such as technology systems, organizational structures, business processes, or key functions in parallel. Most effective when all items hold equal importance, achieving both information organization and visual balance simultaneously.
-
How to Use
Enter title and description text in each parallelogram box, then customize circular icons to match your industry or purpose. Adjust colors to your brand palette or use as-is. For additional items, duplicate the slides to expand the layout.
-
Recommended For
Ideal for IT and technology companies explaining system architecture, manufacturing firms presenting production processes, consulting firms showcasing solution structures, educational institutions describing learning modules, and startups visualizing business models.
-
Slide Structure
Both slides feature identical layouts with four parallelogram text boxes arranged in a 2×2 grid. Each box has a circular icon (green, orange, cyan, dark green) positioned on the left, with clearly separated title and description text areas.
Related Products
-

Combining Key Factors for Maximum Impact – Stylish Presentation
#Technical Approach #Diagram #Service Architecture Diagram
-

Coffee Bean Overlap Diagram – Business Strategy and Service Composition
#Business Vision and Strategy #Technical Approach #Diagram
-

Market Share Donut Pie Chart - Harmony of Data and Feel
#Technical Approach #Diagram #Service Development Plan
-

System Overlap Diagram – Effective Visualization of Service Development Strategies
#Technical Approach #Diagram #Service Development Plan
