Combining Key Factors for Maximum Impact – Stylish Presentation
RB0800032_9
- Last Update 03/24/2025
- File Size 0.1MB
- # of Slides 2
- File Format PPTX
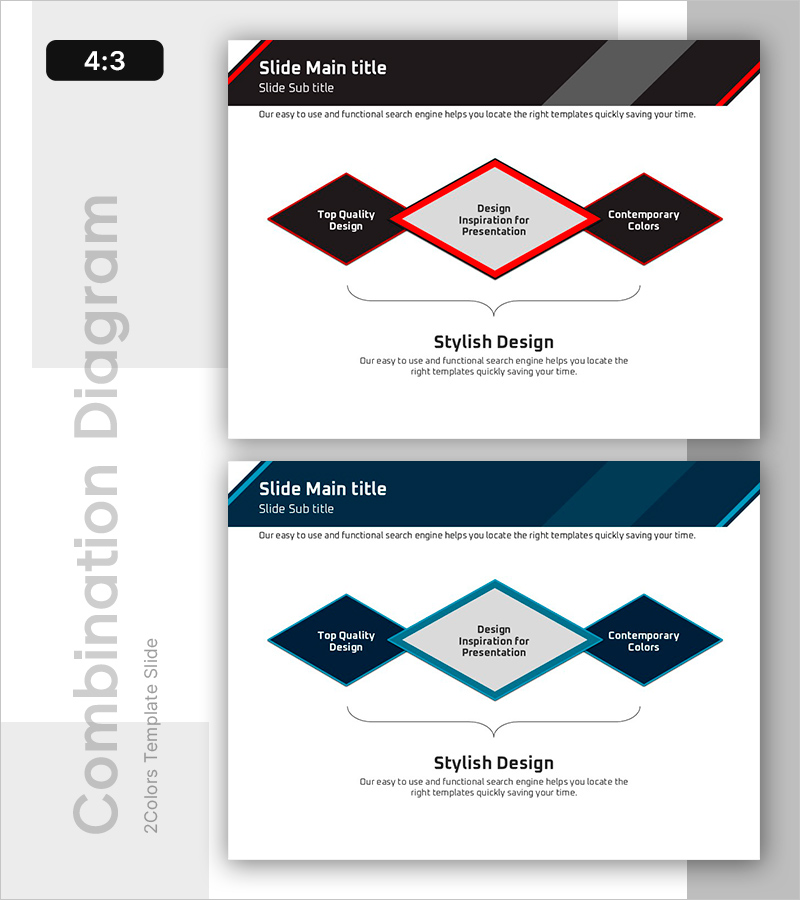
- Slide Ratio 4:3
- Color
Keywords
About the Product
A visually striking overlapping diagram PowerPoint slide that combines key factors for maximum impact in your presentation. Three diamond-shaped nodes in contrasting red and blue tones create a layered structure representing hierarchical relationships between strategic elements, design inspiration, and contemporary execution. This slide template effectively communicates interconnected concepts in business reports, marketing plans, and strategic presentations. The 4:3 aspect ratio with 2 slides is fully editable and ready to customize for corporate communications, pitch decks, and executive briefings.
Usage Points
-
Main Usage
Visualizes the interconnection and hierarchical relationships between three core elements such as strategy, design, and execution. The overlapping diamond-node structure emphasizes each factor's influence and connectivity, enhancing audience comprehension of complex business concepts.
-
How to Use
Insert this diagram into corporate strategy presentations, marketing planning documents, and business reports to illustrate core messaging. Customize each node with your own text to represent organizational values, strategic pillars, or implementation phases. Adjust colors and node positioning to emphasize priority and sequence.
-
Recommended For
Ideal for executives, strategy managers, marketing planners, and project leaders explaining relationships between multiple business factors. Perfect for communicating organizational culture, business philosophy, competitive positioning, and multi-layered strategic frameworks.
-
Slide Structure
2-slide template with red or blue header sections and centered overlapping diagram. Three diamond-shaped nodes arranged in left-center-right hierarchy with layered overlap effect. Description text area positioned below the diagram for supporting context and explanations.
Related Products
-

Service Overlay Diagram - Service Composition Overview
#Product/Service Introduction #Technical Approach #Diagram
-

Sea Wide PPT Organization – Visually Appealing Diagram
#Technical Approach #Diagram #Service Architecture Diagram
-

Smart Home Service User Analysis – Customer-Focused Diagram
#Technical Approach #Market and Competitor Analysis #Diagram
-

Service Configuration Diagram Camping Icon
#Business Introduction #Technical Approach #Diagram
