Coffee Bean Overlap Diagram – Business Strategy and Service Composition
RJ0600003_16
- Last Update 06/21/2025
- File Size 4.9MB
- # of Slides 2
- File Format PPTX
- Slide Ratio 16:9
- Color
Keywords
- #Content-Based Slides
- #Design-Based Slides
- #Business Vision and Strategy
- #Technical Approach
- #Diagram
- #Business Strategy
- #Service Components
- #Cluster
- #Spread
- #Combination Diagram
- #Centralized Diagram
- #16:9
- #overlap diagram PowerPoint
- #coffee bean diagram slide
- #3-area business diagram
- #Venn diagram template
- #business strategy diagram PPT
About the Product
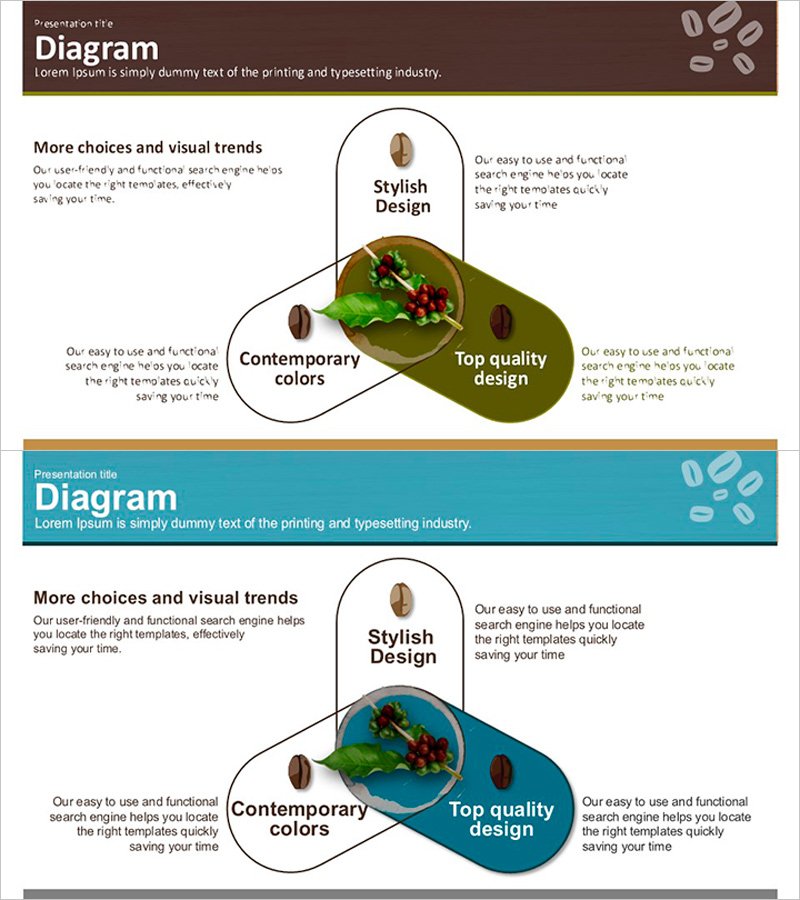
A PowerPoint slide featuring a coffee bean-shaped overlap diagram that visualizes three core business elements. The warm color palette combines brown and olive tones to represent business strategy, service composition, and market positioning. Each overlapping area accommodates text and image insertion, making it immediately applicable to business plans, marketing presentations, and product pitches. The 2-slide set includes color variations in brown and teal, allowing you to select the version that best fits your presentation context.
Usage Points
-
Main Usage
Ideal for visualizing the intersection and distinction between three key concepts. Use it to highlight the convergence of 'stylish design', 'contemporary colors', and 'top quality design', or to clarify relationships between service components in strategic planning sessions.
-
How to Use
Insert your strategy elements, service items, or market characteristics into the text boxes of each overlapping area. Place a coffee bean icon or related imagery in the central zone. Choose between the brown or teal color version to match your presentation theme.
-
Recommended For
Perfect for business strategists, marketing managers, and product development teams presenting at strategy meetings or executive briefings. Especially effective for startup pitches, investor presentations, and new business proposals where emphasizing the balance and interaction of three elements is critical.
-
Slide Structure
Three overlapping oval shapes form the diagram, with text input areas in each section and a central image insertion zone. The first slide features a brown background with olive and cream accents; the second slide uses a teal background with identical structural layout.
Related Products
-

Visual Diagram Highlighting Expected Effects – Strategy for Achieving Business Goals
#Business Vision and Strategy #Business Strategy #Diagram
-

Overlapping Spread Business Strategy Diagram
#Business Vision and Strategy #Diagram #Business Strategy
-

Definition and Goals of Education – Sustainable Development
#Business Vision and Strategy #Diagram #Business Strategy
-

Systemic Connectivity in a Circular Model – Innovative Service Structure
#Business Vision and Strategy #Technical Approach #Diagram
