Tricolor Media Usage Graph for Market Share Analysis – Successful Business Strategy
RJ0800026_20
- Last Update 08/06/2025
- File Size 0.9MB
- # of Slides 2
- File Format PPTX
- Slide Ratio 16:9
- Color
Keywords
- #Content-Based Slides
- #Design-Based Slides
- #Business Strategy
- #Market and Competitor Analysis
- #Graph
- #Other
- #Achievements
- #Market Share
- #Circles
- #Doughnut Chart
- #16:9
- #donut chart PowerPoint slide
- #pie chart template download
- #market share analysis visualization
- #regional data comparison
- #proportion chart design
About the Product
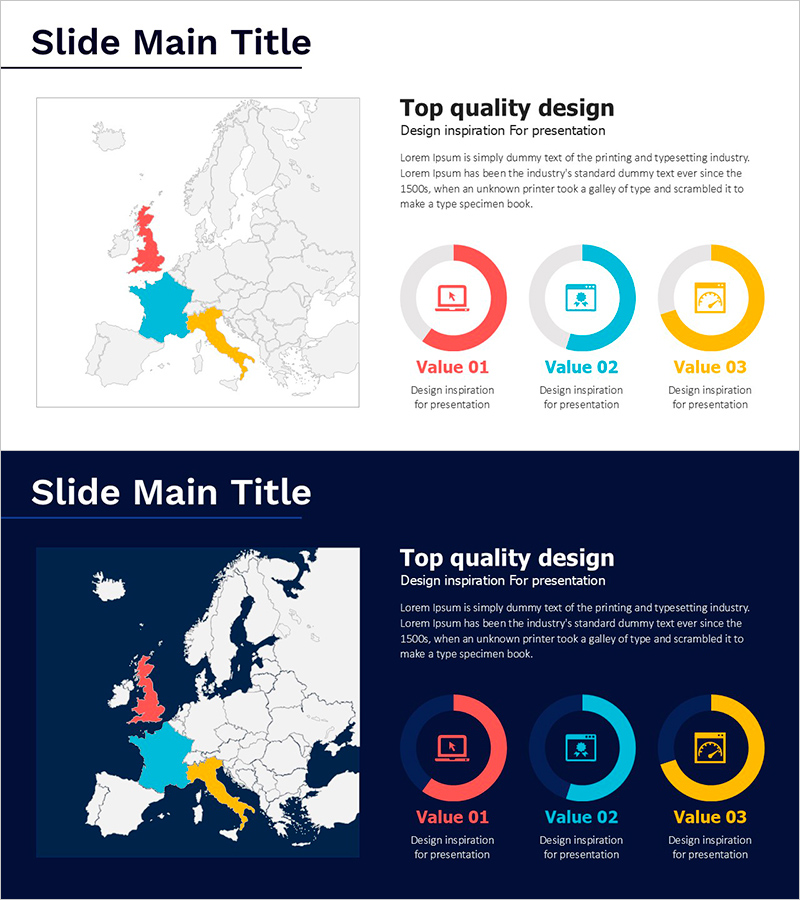
A PowerPoint slide set combining a Europe map with three-color donut charts for visualizing regional data distribution. The design displays media usage patterns across UK (red), France (blue), and Italy (yellow), with each donut chart clearly representing the proportion of three data categories. The light background and colorful icons enhance data readability, making it ideal for business performance analysis, market share comparison, and regional statistics presentations. The 16:9 format with 2 slides integrates seamlessly into presentation flows.
Usage Points
-
Main Usage
Visualize multi-category proportions across regions using donut charts, enabling clear comparison of market share, media consumption patterns, and customer distribution. The map-chart combination strengthens the persuasiveness of region-based statistical presentations and business analysis.
-
How to Use
Replace the chart values and labels with your own data. Customize map highlighting and chart colors to match your presentation context. Insert directly into business reports, marketing plans, investor presentations, or quarterly performance reviews without additional formatting.
-
Recommended For
Marketing managers, business planners, financial analysts, regional sales directors, and market research professionals presenting regional performance, customer distribution, or market penetration data. Particularly effective for multinational companies delivering global strategy presentations or region-based business analysis.
-
Slide Structure
Two-slide set with the first slide featuring a light background displaying a Europe map and three donut charts in a horizontal layout, and the second slide repeating the same structure on a dark navy background for presentation tone variation. Each donut chart segments three data series with distinct colors, supported by icons and text labels for data clarity.
Related Products
-

Future Target Market Share Donut Chart – Performance and Competitiveness
#Business Strategy #Market and Competitor Analysis #Graph
-

Donut Chart and Mobile Mockup – Market Share Analysis
#Business Strategy #Market and Competitor Analysis #Graph
-

Blue Green Progress Visualization – Graph for Achievement Rate
#Product/Service Introduction #Business Strategy #Market and Competitor Analysis
-

Target Market Map for the US Space Industry – Market Analysis Slide
#Market and Competitor Analysis #Graph #Other
