Orange Purple Mixed Graph - Market Competition Analysis
RJ0500033_18
- Last Update 06/16/2025
- File Size 0.5MB
- # of Slides 2
- File Format PPTX
- Slide Ratio 16:9
- Color
Keywords
About the Product
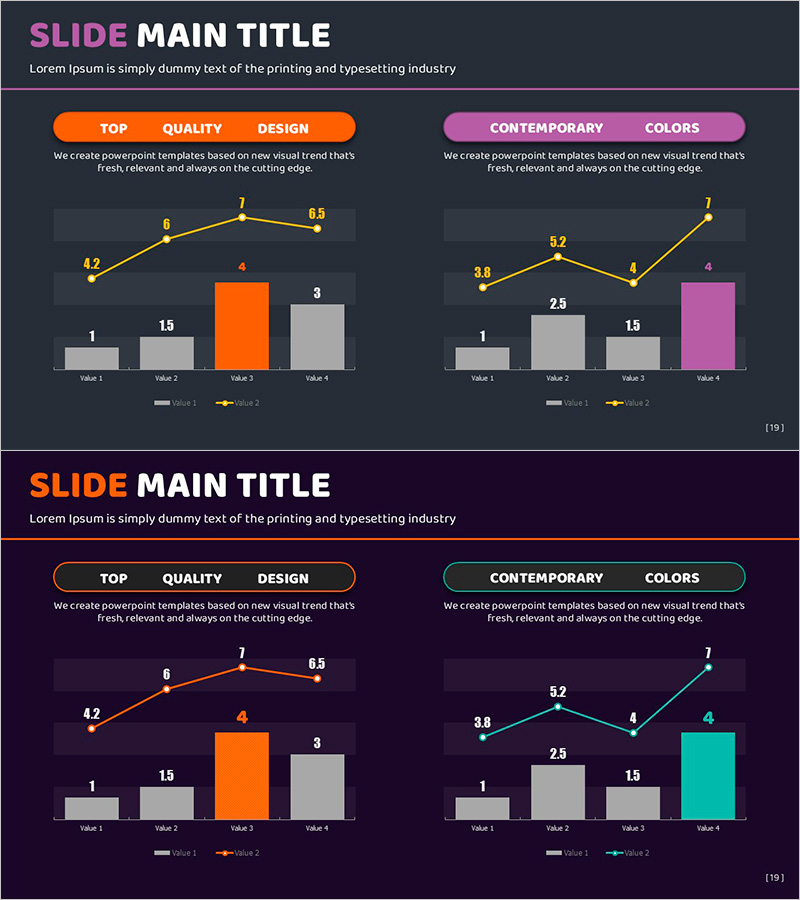
A 2-slide PowerPoint presentation designed for market competitive analysis. Features a mixed orange and purple color scheme with side-by-side comparison graphs to visualize competitor data. The left panel highlights orange bar charts combined with line graphs, while the right panel uses purple accents for dual-metric comparison. Dark background with bright color contrast enhances presentation impact. Each section includes descriptive text areas and is optimized for quick data entry, making it ready for investor pitches, executive briefings, and marketing strategy sessions.
Usage Points
-
Main Usage
Simultaneously compare two metrics such as competitor market share, revenue trends, or customer satisfaction scores. The left and right sections enable side-by-side competitor comparison or time-series analysis of a single competitor. Supports data-driven decision-making with clear visual hierarchy.
-
How to Use
Deploy in investor relations presentations, executive quarterly reviews, and marketing strategy meetings during competitive landscape analysis sections. Input competitor metrics into bar charts and trend data into line graphs to illustrate market dynamics. Add analysis titles and key insights in the text boxes above each panel.
-
Recommended For
Strategy planners, marketing managers, business development professionals, financial analysts, and executive reporting teams preparing competitive analysis materials. Essential for quarterly competitive reviews, new market entry assessments, and fundraising documentation.
-
Slide Structure
2-slide deck with left-right 2-panel layout. Each slide contains a title text box at top, bar charts (4 data points) in center, and line graphs (2 trend lines) at bottom. First slide emphasizes orange accents; second emphasizes purple to distinguish different analytical perspectives.
Related Products
-

Hybrid Graph for Competitor Analysis – Visualizing Market Trends
#Market and Competitor Analysis #Graph #Other
-

Graph Comparing Transportation Methods – Market Overview Analysis
#Market and Competitor Analysis #Graph #Other
-

Comparative Analysis Mixed Graph – Market Conditions and Competitor Analysis
#Market and Competitor Analysis #Graph #Other
-

Smart Area Analysis Graph – Market and Competitor Analysis Tool
#Market and Competitor Analysis #Graph #Other
