Hybrid Graph for Competitor Analysis – Visualizing Market Trends
RJ0500015_11
- Last Update 06/11/2025
- File Size 6MB
- # of Slides 2
- File Format PPTX
- Slide Ratio 16:9
- Color
Keywords
- #Content-Based Slides
- #Design-Based Slides
- #Market and Competitor Analysis
- #Graph
- #Other
- #Market Status
- #Competitor Analysis
- #16:9
- #column chart PowerPoint slide
- #competitor analysis presentation
- #dual-series comparison chart
- #market data visualization
- #how to create competitor analysis in PowerPoint
About the Product
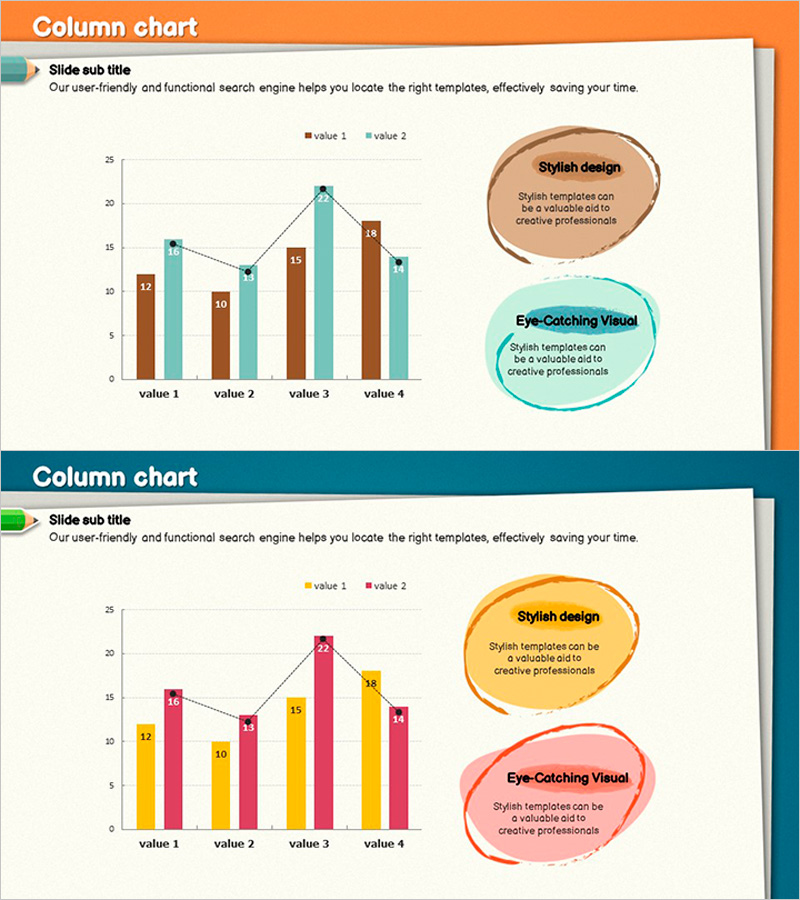
A PowerPoint slide featuring a column chart designed for competitor analysis and market positioning assessment. Available in two color versions—orange and navy backgrounds—each displaying a dual-series comparison across four data categories. Callout boxes labeled 'Stylish design' and 'Eye-Catching Visual' on the right side emphasize key insights during presentations. All elements including title, subtitle, legend, and data labels are fully editable, allowing you to input actual competitor metrics instantly. Ideal for investor pitches, market analysis reports, strategic planning sessions, and competitive landscape presentations.
Usage Points
-
Main Usage
Compares two-series metrics (e.g., competitor revenue, market share, sales volume) across four categories in a single visual. Accompanying callout boxes highlight critical insights, making it effective for presenting competitive analysis findings and supporting strategic decisions.
-
How to Use
Enter your analysis topic in the slide title (e.g., 'Competitor Revenue Comparison'). Update the legend labels 'value 1' and 'value 2' with actual competitor names. Replace chart data with your metrics, then populate the right-side callout boxes with analysis conclusions and strategic implications.
-
Recommended For
Strategic planning meetings, investor presentations, market analysis reports, executive briefings, and business plan development phases. Suitable for marketing teams, strategy departments, C-suite executives, and investor audiences presenting competitive landscape assessments.
-
Slide Structure
Comprises slide title (1), subtitle (1), column chart (4 categories, 2 series, with data labels), and two explanation callout boxes. Legend positioned left of chart; 'Stylish design' and 'Eye-Catching Visual' text boxes on the right create clear information hierarchy.
Related Products
-

Graph Comparing Transportation Methods – Market Overview Analysis
#Market and Competitor Analysis #Graph #Other
-

Orange Purple Mixed Graph - Market Competition Analysis
#Market and Competitor Analysis #Graph #Other
-

Comparative Analysis Mixed Graph – Market Conditions and Competitor Analysis
#Market and Competitor Analysis #Graph #Other
-

Graph of Usage Patterns by Year – Visualizing Market Conditions through Cluster Slides
#Market and Competitor Analysis #Diagram #Graph
