Technical Competency Icons and Arrows Slide
RJ0500032_16
- Last Update 06/15/2025
- File Size 0.2MB
- # of Slides 2
- File Format PPTX
- Slide Ratio 16:9
- Color
Keywords
About the Product
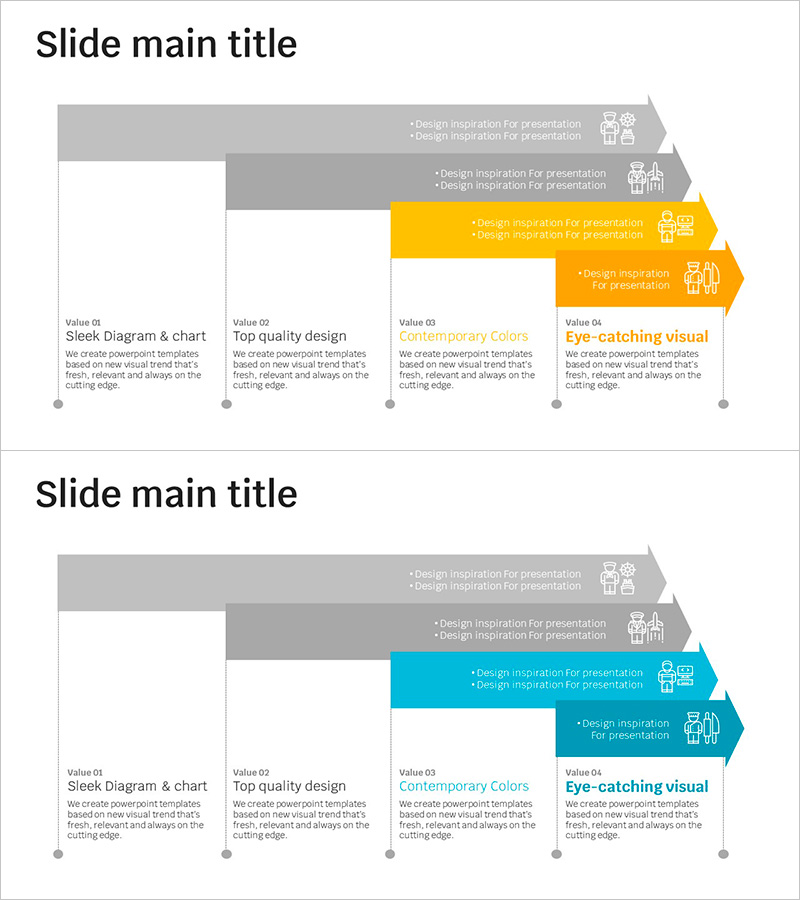
A 4-stage arrow diagram PowerPoint slide that visualizes technical competency progression and career development pathways. The design combines professional icons with gradient arrows in gray, yellow, and orange tones on the first slide, and gray-blue tones on the second slide. This two-slide set allows you to select the color scheme that best matches your presentation context. Each stage includes dedicated text input areas for describing technical stacks, competency levels, and skill progression, making it ideal for technical training, capability assessments, and workforce development presentations.
Usage Points
-
Main Usage
Illustrate technical skill progression, career advancement stages, and competency development pathways using sequential arrow diagrams. Helps audiences understand how technical expertise evolves across different career phases. Ideal for technical training programs, capability assessments, and workforce development strategy presentations.
-
How to Use
Enter technical skill names, competency descriptions, and technology stacks in each arrow stage to map out skill progression. Choose between two color schemes (yellow-orange gradient or blue gradient) based on your presentation theme and background. Icons can be customized to match your specific technical domains or job functions.
-
Recommended For
Technology leaders, HR professionals, training managers, and IT directors presenting technical capability assessments, career development plans, and team skill enhancement programs. Suitable for technical education seminars, competency development workshops, and strategic workforce planning presentations.
-
Slide Structure
Two-slide set with identical 4-node arrow flow structure. First slide features gray-to-yellow-to-orange gradient arrows; second slide uses gray-to-blue gradient. Each arrow node contains a professional icon and text input area for stage descriptions, enabling clear visualization of technical progression.
Related Products
-

PowerPoint Template for Service Operation Strategy Presentation
#Business Management #Operational Plan #Technical Approach
-

Organization Chart of the Cosmetics Development Team – Modern Design
#Company Introduction #Diagram #Organizational Chart
-

Office Desk Infographic – Marketing Strategy and Cluster Utilization
#Business Management #Marketing Plan and Strategy #Diagram
-

Spring PowerPoint SWOT Analysis – Slide Embodying Opportunities and Threats
#Market and Competitor Analysis #Diagram #SWOT Analysis
