Comparative Analysis Table Chart for Financial Performance – Trust and Expertise
RM0100009_31
- Last Update 01/27/2025
- File Size 0.7MB
- # of Slides 2
- File Format PPTX
- Slide Ratio 16:9
- Color
Keywords
- #Content-Based Slides
- #Design-Based Slides
- #Financial Plans and Performance
- #Diagram
- #Balance Sheet
- #Income Statement
- #Table
- #Standard Table
- #16:9
- #comparative analysis table PowerPoint
- #financial performance table slide
- #horizontal data table template
- #balance sheet PPT slide
- #income statement PowerPoint
- #financial comparison chart
About the Product
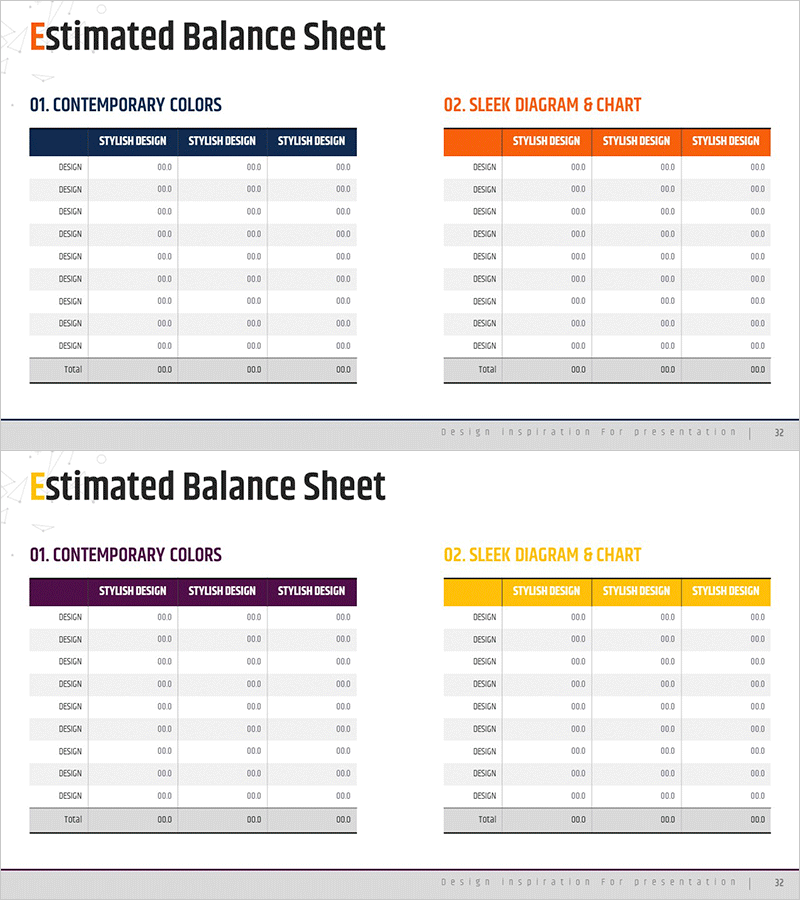
A horizontal table diagram PowerPoint slide designed to compare financial performance and business metrics at a glance. Two color versions are provided: one with a dark navy header and one with an orange accent line, each featuring a 3-column data structure for clear alignment. Optimized for balance sheets, income statements, and budget comparisons, this slide effectively presents numerical data and text. Available in 16:9 widescreen PPTX format, fully editable and ready to enhance credibility in corporate presentations and financial reports.
Usage Points
-
Main Usage
Presents financial metrics, budget items, and performance figures in a 3-column layout to enable clear period-to-period, department-to-department, or product-to-product comparison. Effectively visualizes balance sheet components (assets, liabilities, equity) or income statement structure (revenue, expenses, profit).
-
How to Use
Use in financial reports, quarterly earnings presentations, investor briefings, and executive dashboards. Modify the header row with period names, department labels, or product names, then input numerical data into the cells. Select the color version that matches your corporate brand identity.
-
Recommended For
CFOs, finance managers, executives, and investor relations professionals presenting financial performance. Ideal for financial institutions' earnings announcements, public companies' quarterly disclosures, and startup investor pitch decks.
-
Slide Structure
2-slide set. Each slide features a horizontal table with a dark navy or orange header row (3 columns) and 9 data rows for numerical input. A total row is positioned at the bottom, with the entire structure designed for easy data entry and professional presentation.
Related Products
-

Table of Contents for Profit Achievement – Visualizing Financial Plans
#Financial Plans and Performance #Diagram #Balance Sheet
-

Geometry Pattern Wide Table PPT Template for Financial Planning and Performance
#Financial Plans and Performance #Diagram #Balance Sheet
-

Yellow Green Income Statement Table – Efficient Financial Analysis
#Financial Plans and Performance #Diagram #Balance Sheet
-

Income Statement Table – Effective Tool for Financial Planning
#Financial Plans and Performance #Diagram #Balance Sheet
