Brown Green Connected Diagram – Business Strategy Visualization
RJ0600001_22
- Last Update 06/21/2025
- File Size 0.1MB
- # of Slides 2
- File Format PPTX
- Slide Ratio 16:9
- Color
Keywords
- #Content-Based Slides
- #Design-Based Slides
- #Business Strategy
- #Operational Plan
- #Diagram
- #Business Processes
- #Flow
- #Cluster
- #Chain Diagram
- #Project Progress
- #16:9
- #4-step diagram PowerPoint
- #connected flow diagram
- #business strategy slide
- #process flow PowerPoint template
- #business process visualization
About the Product
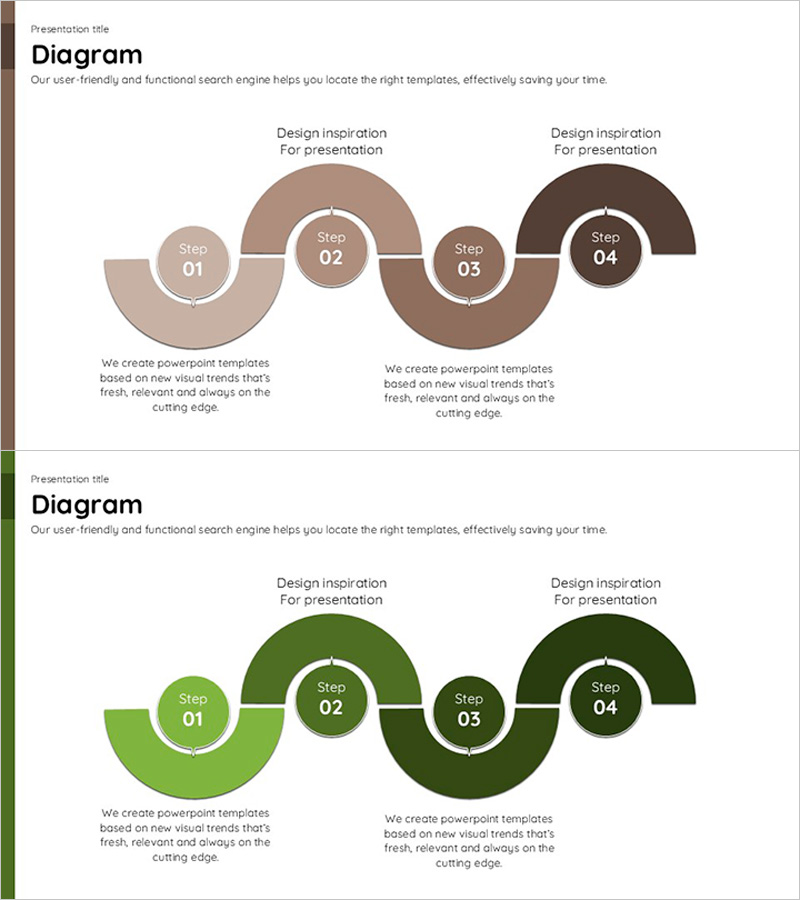
A 4-step connected diagram PowerPoint slide designed to visualize business strategy and process flow. Semicircular nodes in brown and green tones are linked by arrows to clearly represent sequential stages. Each step includes dedicated title and description text areas, making it ideal for presenting business initiatives, project phases, operational workflows, and strategic execution plans. The 2-slide set offers both brown and green color variations, allowing you to match your presentation's tone and branding. Formatted in 16:9 widescreen PPTX for seamless compatibility with modern presentation software.
Usage Points
-
Main Usage
Breaks down business strategy, project execution phases, and operational workflows into 4 distinct stages with visual clarity. The arrow connections emphasize the logical progression between stages, helping audiences understand dependencies and sequential relationships in your business plan.
-
How to Use
Enter stage names (Step 01–04) in the semicircular nodes and add corresponding objectives, activities, or deliverables in the text areas below. Select the brown version for professional credibility or the green version to emphasize growth and sustainability, depending on your presentation context.
-
Recommended For
Business strategists, project managers, and executives presenting to boards, investors, or stakeholders. Also suitable for internal training sessions, organizational change management presentations, and process improvement workshops where step-by-step workflows need clear visual communication.
-
Slide Structure
2-slide set with identical layouts in different color schemes. Each slide features 4 semicircular nodes (80–120px diameter) connected horizontally by arrows. Circular badges (Step 01–04) are centered in each node, with title and description text boxes positioned below. Slide 1 uses brown tones (light beige to dark brown), Slide 2 uses green tones (light green to dark forest green).
Related Products
-

Transport Icons and Flowcharts – Business Strategy
#Business Strategy #Operational Plan #Diagram
-

Investment Process Diagram – Visualization of Business Strategy
#Business Strategy #Operational Plan #Diagram
-

Business Process Diagram – Optimizing Workflow
#Business Strategy #Operational Plan #Diagram
-

Business Service Differentiation Strategy – Diagram for Successful Operations
#Product/Service Introduction #Operational Plan #Diagram
