Detailed Schedule and Task Analysis Diagram
RJ0500032_13
- Last Update 06/15/2025
- File Size 0.1MB
- # of Slides 2
- File Format PPTX
- Slide Ratio 16:9
- Color
Keywords
- #Content-Based Slides
- #Design-Based Slides
- #Operational Plan
- #Diagram
- #Project Implementation Schedule
- #Business Processes
- #Cluster
- #Closed Cluster Diagram
- #16:9
- #task analysis diagram PowerPoint
- #project schedule slide template
- #3-stage closed diagram
- #work breakdown structure PPT
- #project planning presentation
- #business diagram slide download
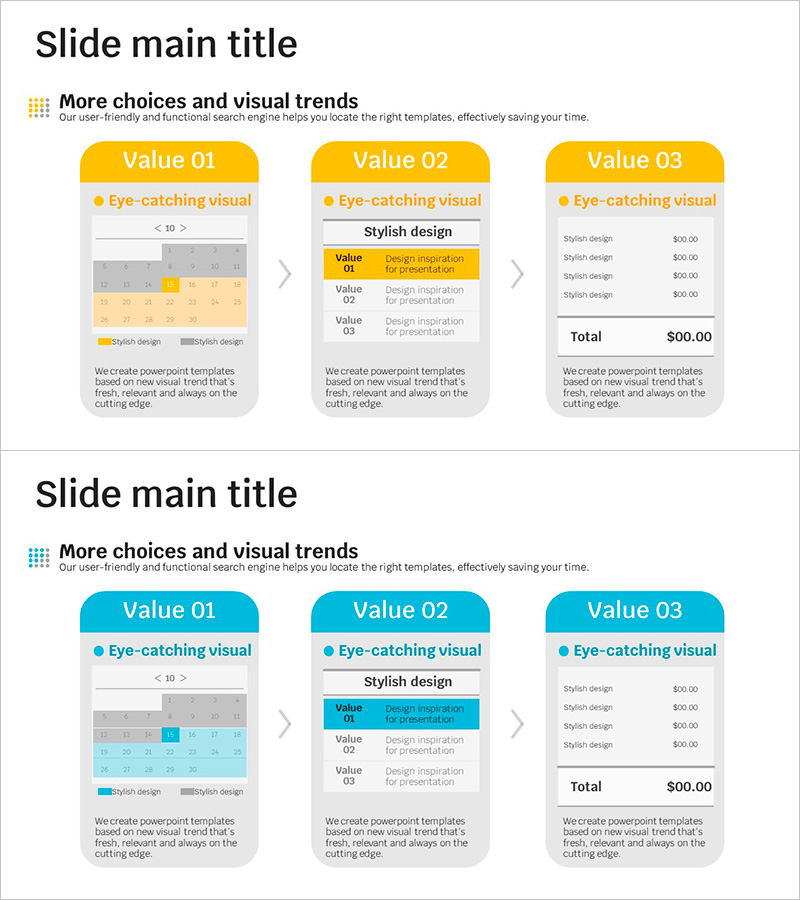
About the Product
A 2-slide closed-form task analysis diagram PowerPoint template that visualizes project schedules and work breakdown structures. The dual-tone yellow and cyan color scheme clearly separates three workflow stages, each with dedicated areas for detailed descriptions and cost information. The first slide features a calendar-style scheduling grid, while the second integrates a data table for budget analysis. Ideal for project kickoff presentations, team task allocation meetings, and executive budget reviews. Delivered in 16:9 widescreen PPTX format, fully editable across all PowerPoint versions.
Usage Points
-
Main Usage
Categorize project tasks into three distinct stages and display detailed work items, timelines, and budgets side-by-side for comprehensive analysis. The closed-form structure maintains visual separation while presenting an integrated project overview, making it effective for executive briefings, team coordination meetings, and client proposal presentations.
-
How to Use
Enter task names in the yellow and cyan boxes, mark dates on the calendar grid below, and populate the cost table with budget line items. All text and colors are fully customizable; you can add or remove stages as needed. Duplicate the slide for each project phase (kickoff, checkpoint, final review) to track progress visually across presentations.
-
Recommended For
Project managers, operations coordinators, executives, management consultants, and marketing strategists planning multi-phase projects, allocating departmental tasks, or presenting budget breakdowns. Particularly useful when explaining complex workflows, resource allocation, and financial planning to stakeholders.
-
Slide Structure
Two-slide set: Slide 1 displays three closed-form boxes (yellow-cyan-yellow) with task titles, descriptions, and icons, plus a calendar grid at the bottom for scheduling. Slide 2 positions the three boxes on the left with an integrated data table (columns: Item, Description, Price) on the right for cost analysis and budget tracking.
Related Products
-

The Process of Gardening - Business Strategy and Operational Planning
#Business Strategy #Operational Plan #Diagram
-

Big Data Development Schedule to Formulate Business Strategy
#Business Strategy #Operational Plan #Diagram
-

Preparation Procedure for the Wedding Hall – Roadmap for Weddings
#Business Strategy #Operational Plan #Diagram
-

Accommodation Reservation Diagram – Effectively Communicate Business Strategy
#Business Strategy #Operational Plan #Diagram
