Imagination and Text Box – Maximize Visual Impact Slides
RJ0500031_11
- Last Update 06/15/2025
- File Size 5.3MB
- # of Slides 2
- File Format PPTX
- Slide Ratio 16:9
- Color
Keywords
- #Content-Based Slides
- #Design-Based Slides
- #Business Management
- #Operational Plan
- #Diagram
- #Execution Plan
- #Business Processes
- #Cluster
- #Closed Cluster Diagram
- #16:9
- #speech bubble text box PowerPoint
- #3-item point slide
- #PowerPoint text box design
- #circular number marker slide
- #image and text combination PPT
About the Product
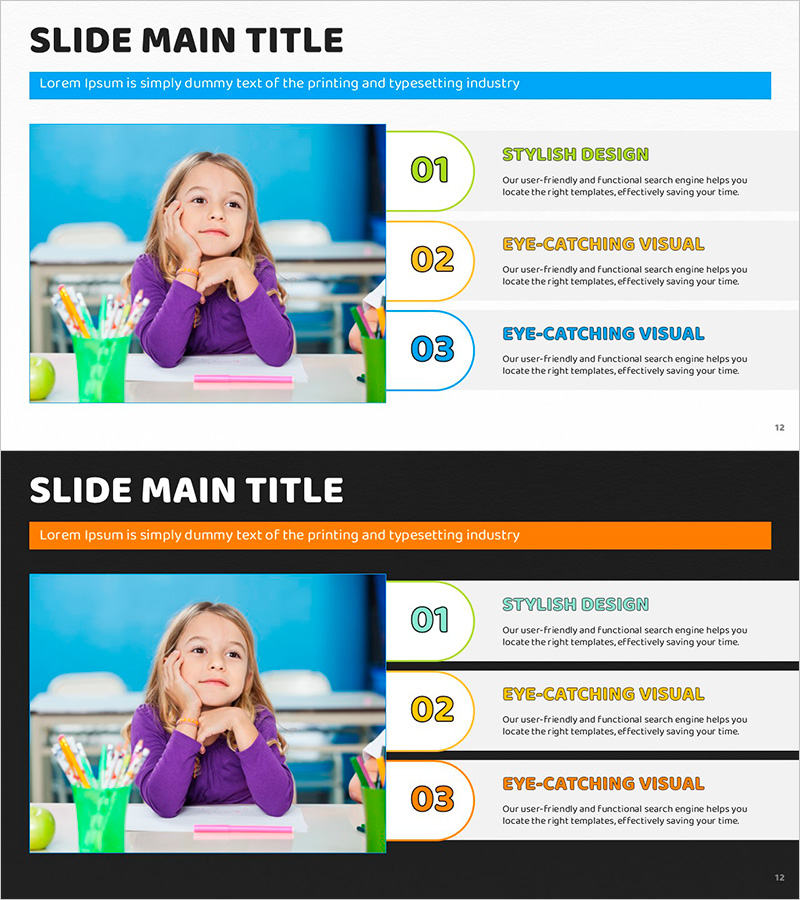
A PowerPoint slide combining an image with three speech bubble text boxes featuring blue, orange, and green circular number markers. The layout divides the slide into a left image area and right text area, allowing you to showcase a product photo alongside three key points or features. Each speech bubble includes space for a heading and descriptive text, making it ideal for product presentations, service overviews, and business proposals. This 2-slide set in 16:9 widescreen format is fully editable and ready to customize.
Usage Points
-
Main Usage
Highlight and explain three key features or benefits of a product or service with visual impact. The left image area showcases the product visually while the right speech bubbles clearly communicate each feature. Ideal for marketing materials, product brochures, and business proposals to capture client attention.
-
How to Use
Insert a product photo or related visual in the left image area. Add feature titles and descriptions to each of the three speech bubbles on the right. The blue, orange, and green circular numbers represent visual hierarchy, so arrange them in order. Adjust speech bubble sizes based on text length to maintain layout balance.
-
Recommended For
Marketing teams, sales professionals, product managers, and business development specialists presenting product features to clients. Particularly effective for B2B proposals, new product launches, and service introduction presentations where three key points need emphasis.
-
Slide Structure
2-slide set. Each slide is divided into a left image area (approximately 40%) and right text area (approximately 60%), with three speech bubble text boxes vertically arranged featuring blue, orange, and green circular number markers. Top blue header bar available for title input.
Related Products
-

Design Flow Diagram – Optimization for Efficient Business Operations
#Business Management #Operational Plan #Diagram
-

Step-by-Step Climbing Preparation Guide – Designed for Seamless Execution
#Business Management #Operational Plan #Diagram
-

4-Step Process Diagram – Cluster-Based Workflow Presentation
#Business Management #Operational Plan #Diagram
-

Spoons Process Diagram – Visualization of Operational Strategy
#Business Strategy #Operational Plan #Diagram
