Diagonal Emphasis Donut Graph – Visualizing Market Share Effectively
RJ0500030_11
- Last Update 06/15/2025
- File Size 0.6MB
- # of Slides 2
- File Format PPTX
- Slide Ratio 16:9
- Color
Keywords
About the Product
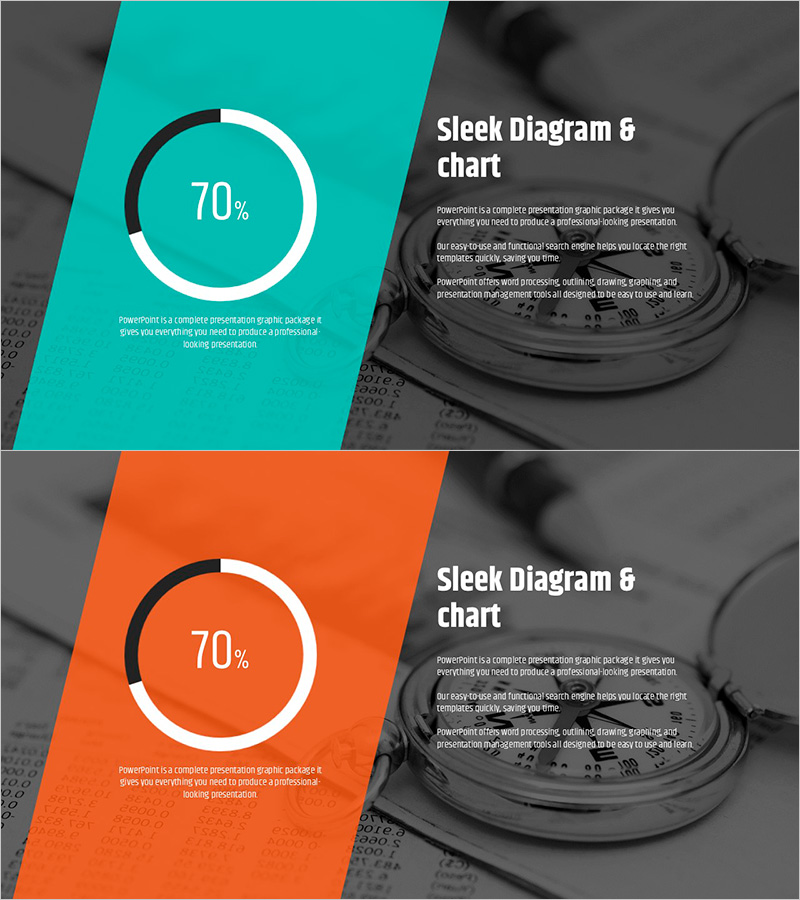
A professional donut chart PowerPoint slide designed to visualize proportional data such as market share, sales distribution, customer satisfaction, and budget allocation. The circular chart features a bold black outline with white fill, prominently displaying the central percentage (70%) for maximum impact. Available in two color variants—turquoise and orange—with diagonal background design that adds dynamic visual interest to your presentation. This 2-slide template is optimized for 16:9 widescreen format and ready for immediate use. Ample text areas allow you to add descriptions, data labels, or additional context without cluttering the design.
Usage Points
-
Main Usage
Effectively communicate proportional data by displaying percentages in a circular chart format with emphasis on the central value. Ideal for presenting market share, sales breakdown, customer satisfaction ratings, budget distribution, and composition ratios in business presentations.
-
How to Use
Use this slide in business reports, marketing presentations, financial analysis, and market research briefings to visualize percentage-based data. Easily modify the central percentage, adjust colors to match your brand, and customize text labels to fit your specific data narrative.
-
Recommended For
Marketing professionals, financial analysts, executives, management consultants, and data analysts presenting quarterly reports, performance reviews, client proposals, and strategic planning sessions will find this template highly effective.
-
Slide Structure
The template consists of 2 slides, each featuring a single donut-shaped pie chart with a 70% value displayed in the center. The design combines a black-outlined, white-filled donut with a diagonal-striped background (turquoise or orange) on the left and a neutral gray background on the right, creating a modern split-layout composition.
Related Products
-

Watercolor Customer Analysis Donut Chart – Visualizing Market Share
#Market and Competitor Analysis #Graph #Market Share
-

Visualizing Market Share with Watercolor Donut Chart
#Market and Competitor Analysis #Graph #Market Share
-

Avocado Share Chart – Market Status and Competitive Analysis
#Market and Competitor Analysis #Graph #Other
-

Travel Guide Business Goal Market Strategy Donut Chart – Market Share Analysis
#Market and Competitor Analysis #Marketing Plan and Strategy #Graph
