Kids Radar Analysis Table - Strengthening Market Competitiveness
RJ0500029_28
- Last Update 06/15/2025
- File Size 1.2MB
- # of Slides 2
- File Format PPTX
- Slide Ratio 16:9
- Color
Keywords
About the Product
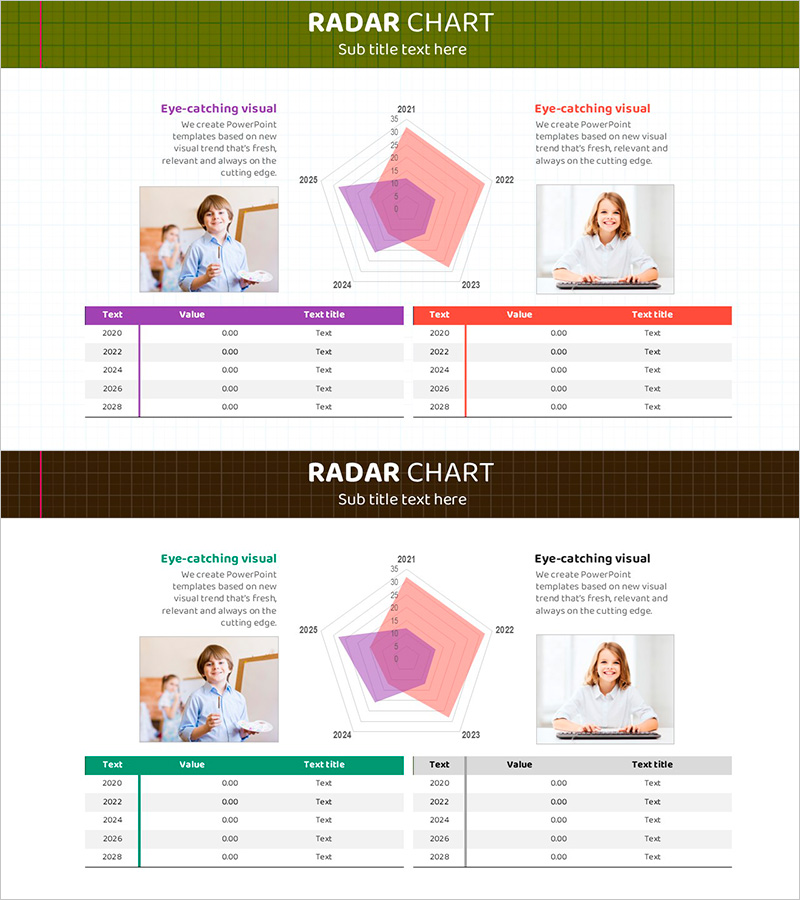
A radial radar chart PowerPoint slide visualizing five dimensions of competitive analysis. Two overlapping polygons in pink and purple gradient fill represent year-over-year comparisons across five axes labeled 2020–2028. Below the chart, two data tables with editable text, value, and title fields enable detailed metric input. Ideal for comparing market competitiveness, customer satisfaction, product quality, pricing power, and brand awareness simultaneously. This presentation slide is ready to use in executive reports, strategy meetings, and business analysis decks.
Usage Points
-
Main Usage
This slide enables multi-dimensional data comparison using a radial radar format. Simultaneously visualize five key metrics—market competitiveness, product quality, customer satisfaction, pricing power, and brand awareness—to identify strengths and weaknesses at a glance.
-
How to Use
Deploy in executive briefings, strategy sessions, marketing planning presentations, and business analysis reports. Input numerical values on each axis to auto-generate the polygon shape, then populate the data tables below with detailed metrics to provide quantitative evidence.
-
Recommended For
Executives, marketing managers, strategic planning teams, consultants, and business analysts preparing competitive comparisons, market positioning analyses, and performance evaluations. Suitable for year-over-year trend analysis and departmental capability assessments.
-
Slide Structure
Two overlapping radial polygons (pink and purple gradient) centered on five axes spanning 2020–2028. Photo areas and text descriptions flank the chart on left and right. Two editable data tables (purple and red headers, 5 rows × 3 columns each) positioned below for metric input.
Related Products
-

Camping Competitor Characteristic Analysis Pentagon Graph
#Market and Competitor Analysis #Diagram #Graph
-

Art and Science Radar Charts – Visual Data Analysis
#Market and Competitor Analysis #Diagram #Graph
-

Pentagon Radial Graph & Table – Visualizing Customer Analysis
#Business Introduction #Market and Competitor Analysis #Diagram
-

Four Color Infographic Presentation Template Radar Graph
#Market and Competitor Analysis #Graph #Customer Analysis
