Art and Science Radar Charts – Visual Data Analysis
RJ0500027_14
- Last Update 06/14/2025
- File Size 1.8MB
- # of Slides 2
- File Format PPTX
- Slide Ratio 16:9
- Color
Keywords
About the Product
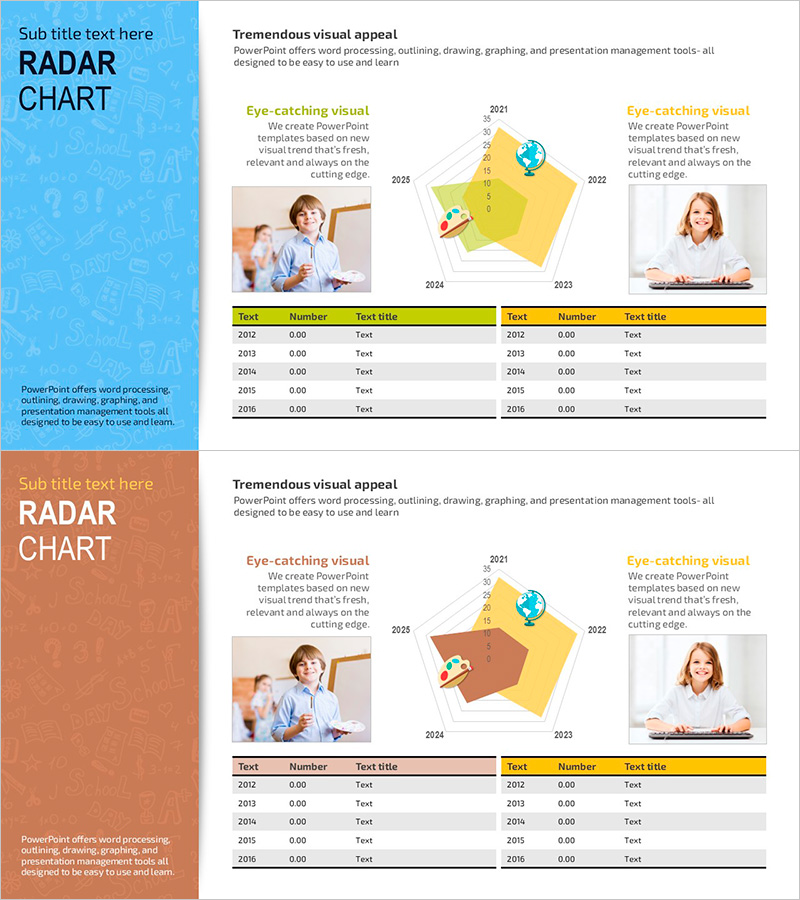
A radial radar chart PowerPoint slide template featuring five data dimensions in a pentagon-shaped diagram. The design combines a bright blue background on one slide and a warm orange background on the other, creating visual variety. Each slide includes a five-point radial diagram, a professional photo, a data table with year-by-year metrics, and key message text. Ideal for market analysis, competitive benchmarking, customer segmentation, and capability assessment. The two-slide set is ready to download and customize for immediate presentation use.
Usage Points
-
Main Usage
Visualize five key metrics or dimensions using a radial pentagon diagram to compare relative strengths, weaknesses, and performance levels. Commonly used for competitive analysis, customer profiling, organizational capability assessment, and strategic positioning in business presentations.
-
How to Use
Enter your five analysis dimensions into the pentagon axes, then adjust the data points to reflect actual values. Input corresponding numerical data into the table below the diagram to create a data-driven narrative. Replace the placeholder photo with relevant imagery to reinforce your message and increase audience engagement.
-
Recommended For
Strategy and planning teams conducting market and competitor analysis, marketing departments performing customer segmentation and positioning studies, HR teams evaluating organizational capabilities, consulting firms presenting comparative analysis, and investment presentations highlighting competitive advantages.
-
Slide Structure
Two-slide template. Each slide features a colored background panel (blue or orange) on the left, a five-point radial diagram with year labels in the center, a professional photograph on the right, and a data table at the bottom with columns for text, number, and text title across five rows.
Related Products
-

Camping Competitor Characteristic Analysis Pentagon Graph
#Market and Competitor Analysis #Diagram #Graph
-

Pentagon Radial Graph & Table – Visualizing Customer Analysis
#Business Introduction #Market and Competitor Analysis #Diagram
-

Kids Radar Analysis Table - Strengthening Market Competitiveness
#Market and Competitor Analysis #Diagram #Graph
-

Architectural Illustration Template Radial Chart – Customer Analysis Visualization
#Market and Competitor Analysis #Graph #Customer Analysis
