Percentage Visualization by Region – Communicating Through Market Analysis
RJ0500026_14
- Last Update 06/14/2025
- File Size 0.9MB
- # of Slides 2
- File Format PPTX
- Slide Ratio 16:9
- Color
Keywords
About the Product
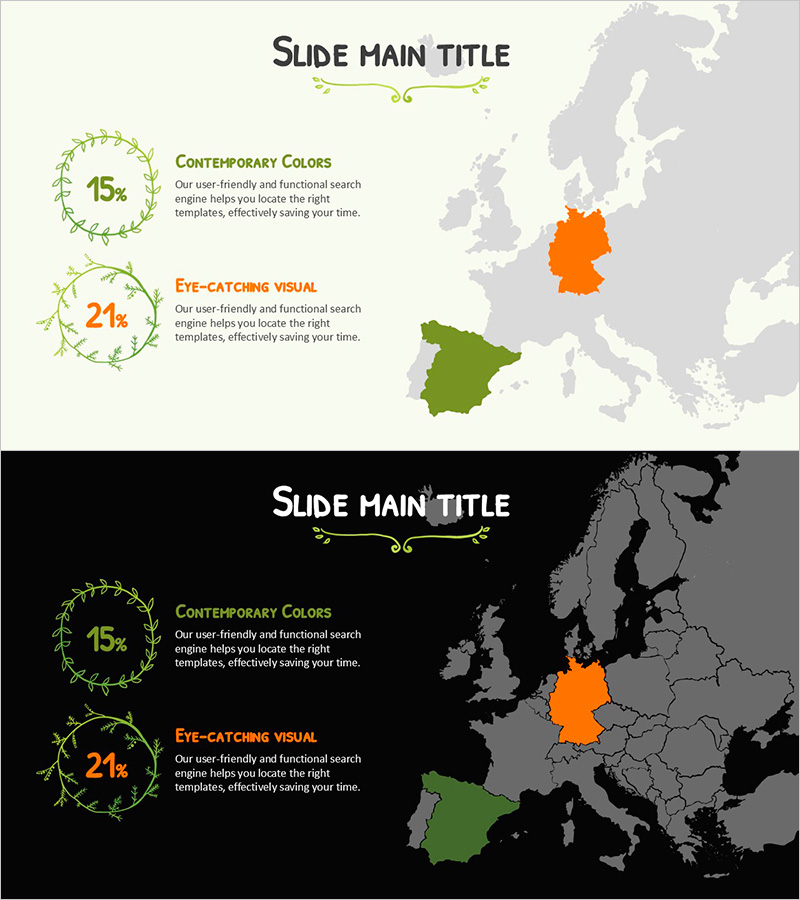
A two-slide PowerPoint presentation featuring a European map with regional percentage comparison using circular charts. The design combines a light beige background with orange and green accent colors to visualize market analysis data intuitively. The layout integrates geographic mapping with data visualization, allowing viewers to grasp regional distribution at a glance. Ample text input areas and numerical display spaces enable immediate customization. Ideal for investor presentations, market status reports, and regional strategy discussions in business contexts.
Usage Points
-
Main Usage
This slide effectively communicates geographic market data such as regional distribution, market share, and growth rates. By combining pie charts with map visualization, it clearly highlights regional differences and persuasively conveys market opportunities to investors, partners, and stakeholders.
-
How to Use
The first slide features a light background layout with map and pie chart; the second offers a dark background high-contrast version. Edit regional percentages and legends with actual data, then adjust colors to match your corporate branding for seamless integration.
-
Recommended For
Marketing managers, executives, investment teams, and regional sales leaders presenting market analysis findings. Suitable for business plans, investor presentations, quarterly performance reports, and regional strategy meetings where geographic opportunities and risks need visual explanation.
-
Slide Structure
Two-slide format with each slide divided into title area, map region, pie chart section, and text description space. The map distinguishes highlighted regions (orange and green) from background areas (gray), with numerical input space adjacent to charts for data-driven analysis ready for immediate use.
Related Products
-

Target Market Year-to-Year Comparison Analysis – Visualizing Market Trends
#Market and Competitor Analysis #Graph #Other
-

Global Goal Achievement Rate Visualization – Insights Through Market Analysis
#Company Introduction #Market and Competitor Analysis #Graph
-

Target Area Market Share Analysis Graph
#Market and Competitor Analysis #Graph #Other
-

Target Country Market Share Analysis Graph
#Market and Competitor Analysis #Graph #Other
