Competitor Analysis Vertical Comparison Graph – Insights and Performance
RJ0500025_7
- Last Update 06/13/2025
- File Size 0.4MB
- # of Slides 2
- File Format PPTX
- Slide Ratio 16:9
- Color
Keywords
- #Content-Based Slides
- #Design-Based Slides
- #Market and Competitor Analysis
- #Graph
- #Competitor Analysis
- #Competitive Advantage
- #Column
- #Grouped Column
- #16:9
- #competitor analysis chart
- #vertical bar chart PowerPoint
- #data comparison presentation
- #market analysis slide
- #bar graph PowerPoint template download
About the Product
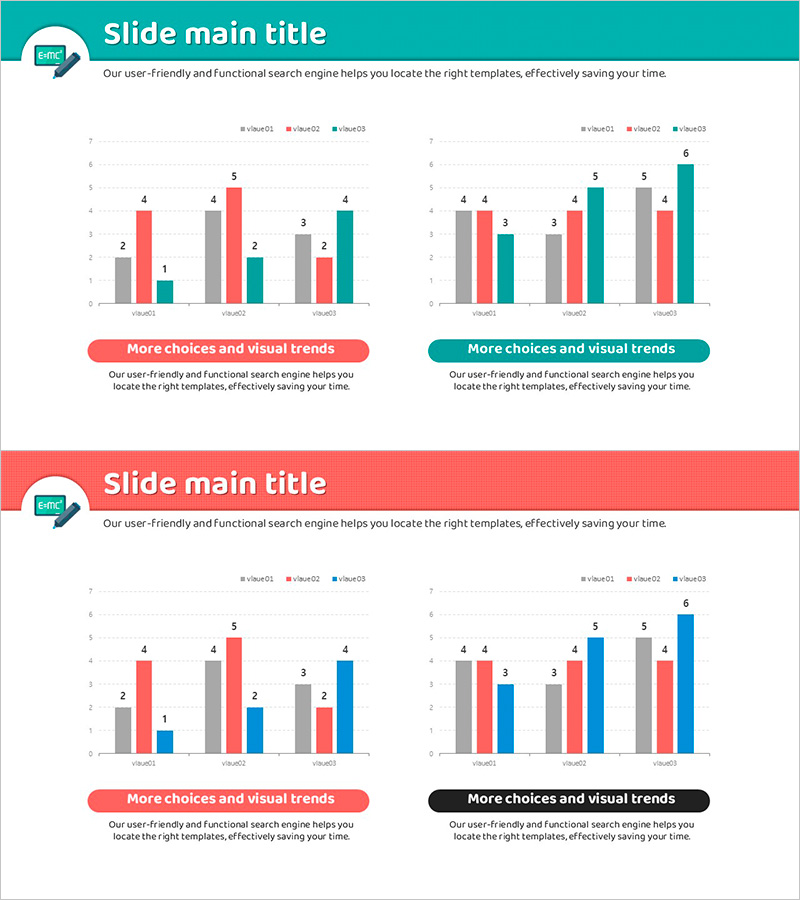
A vertical bar chart PowerPoint slide designed for competitor analysis and market comparison. This presentation template visualizes three data series to clearly communicate competitive positioning and performance metrics. The slide features gray, red, and teal color coding for each series, with two slide layouts to accommodate various presentation scenarios. Ideal for business presentations requiring numerical comparison and market analysis, this PowerPoint slide template is ready to use immediately with your own data.
Usage Points
-
Main Usage
Visualize multi-series competitor metrics, market share, and product comparisons using vertical bar charts to communicate competitive analysis results intuitively. Emphasize data-driven insights in investor presentations, executive reports, and strategic planning meetings.
-
How to Use
Two slide layouts enable left-right or top-bottom arrangement options. Each bar's height and color represent series-specific values. Customize the legend, axis labels, and data points to match your competitive analysis dataset and presentation objectives.
-
Recommended For
Ideal for executives, marketing teams, strategy planners, and sales professionals presenting competitor analysis, market research, and performance comparisons. Effective for market analysis sections in business plans, marketing proposals, and investor pitch decks.
-
Slide Structure
Two slides with dual vertical bar charts per slide. Each chart displays three color-coded series (gray, red, teal) comparing 3-6 data items. Includes legend, title, and descriptive text areas for customization and data annotation.
Related Products
-

Market Competition: Deep Dive into Top 3 Firms
#Market and Competitor Analysis #Graph #Competitor Analysis
-

Triangular Pattern Column Chart Template – Market Competitive Advantage Analysis
#Market and Competitor Analysis #Graph #Competitor Analysis
-

Business Analysis Chart – Visualizing Competitive Advantage
#Market and Competitor Analysis #Graph #Other
-

Competitiveness Table and Chart Analysis – Market and Competitor Analysis
#Market and Competitor Analysis #Diagram #Graph
