Target Market and Advertising Strategy by Age – Insights and Clusters
RM0400014_8
- Last Update 02/19/2025
- File Size 0.8MB
- # of Slides 2
- File Format PPTX
- Slide Ratio 16:9
- Color
Keywords
- #Content-Based Slides
- #Design-Based Slides
- #Market and Competitor Analysis
- #Marketing Plan and Strategy
- #Diagram
- #Customer Analysis
- #Target Setting
- #Cluster
- #Closed Cluster Diagram
- #16:9
- #cluster diagram PowerPoint
- #age group target market slide
- #customer segmentation presentation
- #market analysis diagram
- #demographic targeting template
About the Product
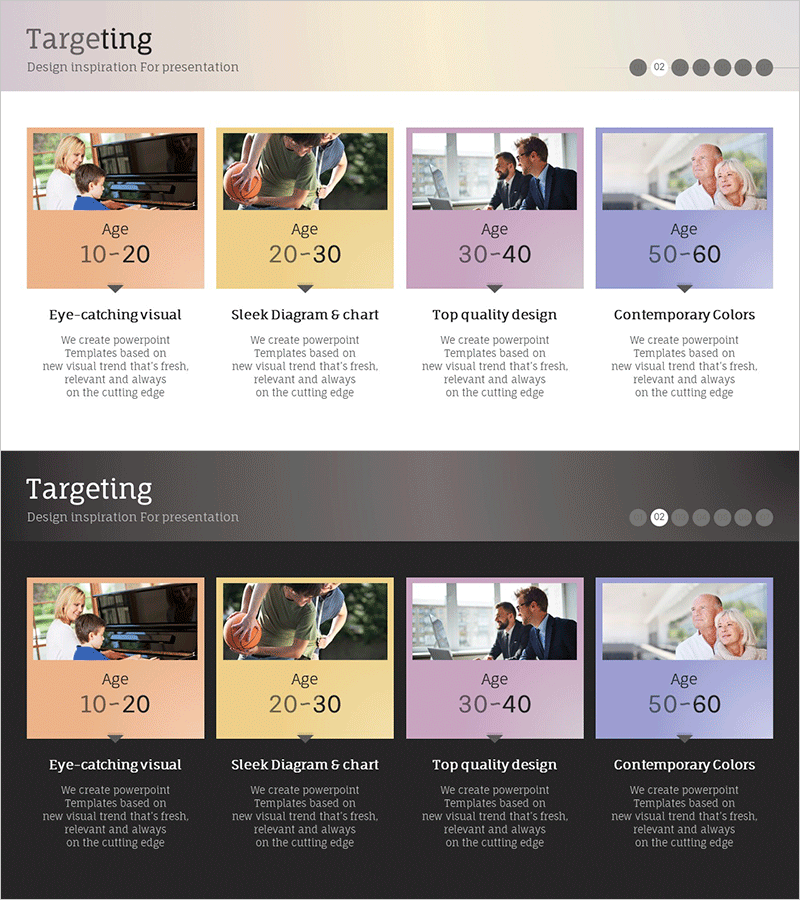
A cluster diagram PowerPoint slide that visually categorizes target markets by age group. Four age segments (10–20, 20–30, 30–40, 50–60) are distinguished by separate colors (peach, yellow, pink, lavender) with corresponding photos and text areas for each demographic. Each cluster includes space to describe age-specific characteristics, advertising strategies, and market insights. Ideal for marketing plans, market analysis reports, and customer segmentation presentations where clear audience differentiation is essential. Provided in 16:9 PPTX format with full editing capability.
Usage Points
-
Main Usage
Clearly classify target customers by age group and compare segment characteristics at a glance during marketing strategy development. Use in market analysis, customer analysis, and advertising strategy phases to visually support target audience definition.
-
How to Use
Fill each age cluster's text area with demographic traits, purchasing power, preferences, and advertising channels. Replace photos with actual target customer images and adjust colors to match brand guidelines.
-
Recommended For
Marketing managers, advertising strategists, business development teams, and market research professionals explaining customer segmentation. Effective for new product launch presentations, marketing plan documents, and investor pitch decks.
-
Slide Structure
Two-slide set. Slide 1 features four age clusters on a light background arranged horizontally; Slide 2 uses a dark background with identical layout. Each cluster has three sections: photo area (top), age label (middle), and descriptive text field (bottom).
Related Products
-

Analysis of Key Target Students Slide
#Market and Competitor Analysis #Marketing Plan and Strategy #Diagram
-

Generation Z and Game & Empathy Mechanisms – Market Insights and Customer Analysis
#Market and Competitor Analysis #Marketing Plan and Strategy #Diagram
-

Lively Kids and Closed Diagram
#Market and Competitor Analysis #Marketing Plan and Strategy #Diagram
-

Male and Female Analysis by Country – Insights on Gender Ratio and Market Trends
#Market and Competitor Analysis #Marketing Plan and Strategy #Diagram
