Purple Yellow Vertical Bundled Chart – Ideal for Market and Competitor Analysis
RJ0500023_5
- Last Update 06/13/2025
- File Size 1.7MB
- # of Slides 2
- File Format PPTX
- Slide Ratio 16:9
- Color
Keywords
About the Product
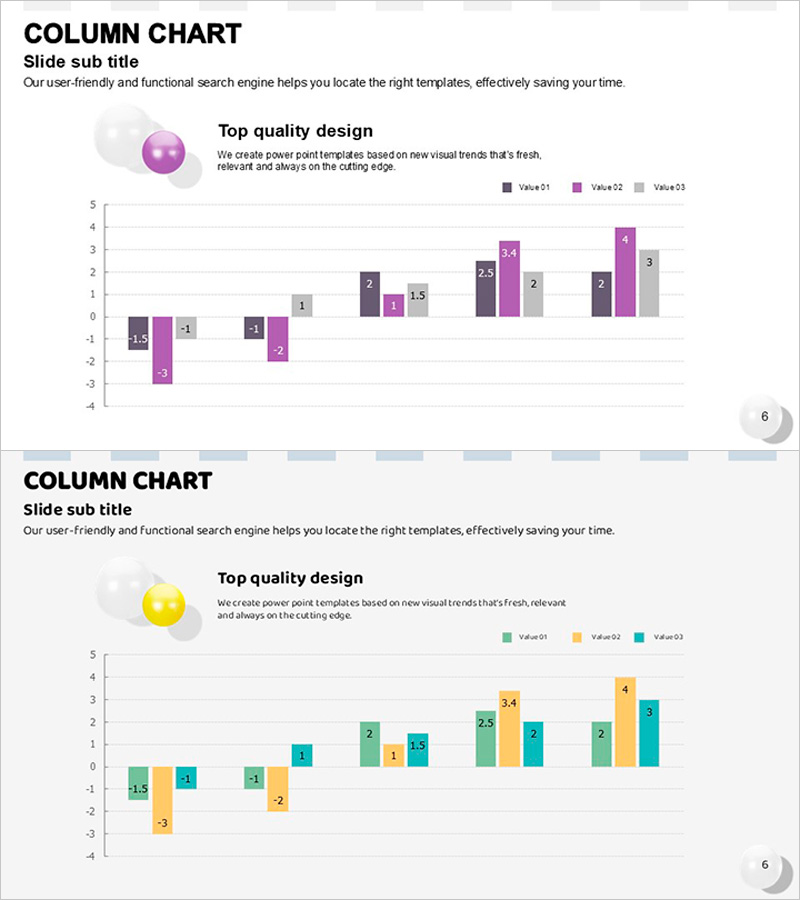
A vertical bundled column chart PowerPoint slide optimized for market analysis and competitor comparison presentations. The design features purple and yellow dual-tone color schemes to display three data series simultaneously, accommodating both positive and negative values. The 2-slide template is formatted in 16:9 widescreen ratio and ready for immediate use in business presentations. Each slide presents grouped columns with clear data labels, making it ideal for quarterly performance reviews, competitive positioning analysis, and market share comparisons.
Usage Points
-
Main Usage
Compares three or more data categories simultaneously, such as market size, competitor performance, or sales figures. Effectively visualizes complex datasets including positive and negative values, making it perfect for quarterly trend analysis, competitive benchmarking, and multi-dimensional performance reviews.
-
How to Use
Insert into marketing plans, business reports, or investor pitch decks within the market analysis section to visualize competitive positioning. The color-coded bars and data labels enable audiences to quickly grasp comparative relationships and identify performance gaps across competitors or product lines.
-
Recommended For
Marketing managers, sales directors, and strategy planners presenting competitive analysis to executives. Ideal for market research presentations, quarterly performance comparisons, product line sales analysis, and any scenario requiring quantitative multi-series data visualization in professional settings.
-
Slide Structure
Two-slide template with the first slide featuring three purple-toned columns and the second slide displaying three yellow-toned columns. Each slide includes an 8-category X-axis and Y-axis range from -4 to 5, with data labels positioned above each column for precise numerical communication.
Related Products
-

Competitiveness Table and Chart Analysis – Market and Competitor Analysis
#Market and Competitor Analysis #Diagram #Graph
-

Market Trend Visualized with Vertical Bar Graph
#Market and Competitor Analysis #Graph #Competitor Analysis
-

PC Mockup & Column Bundle Graph
#Market and Competitor Analysis #Graph #Other
-

Business Bundle Bar Graph – Market Analysis and Competitive Edge
#Market and Competitor Analysis #Graph #Competitor Analysis
