Visualizing Competitive Advantage with Circular Gauge Charts
RJ0500011_10
- Last Update 06/10/2025
- File Size 4.1MB
- # of Slides 2
- File Format PPTX
- Slide Ratio 16:9
- Color
Keywords
- #Content-Based Slides
- #Design-Based Slides
- #Product/Service Introduction
- #Market and Competitor Analysis
- #Graph
- #Development Status
- #Competitive Advantage
- #Circles
- #Doughnut Chart
- #16:9
- #donut gauge chart PowerPoint
- #circular gauge slide template
- #competitive analysis chart
- #how to create gauge chart in PowerPoint
- #comparison analysis slide download
About the Product
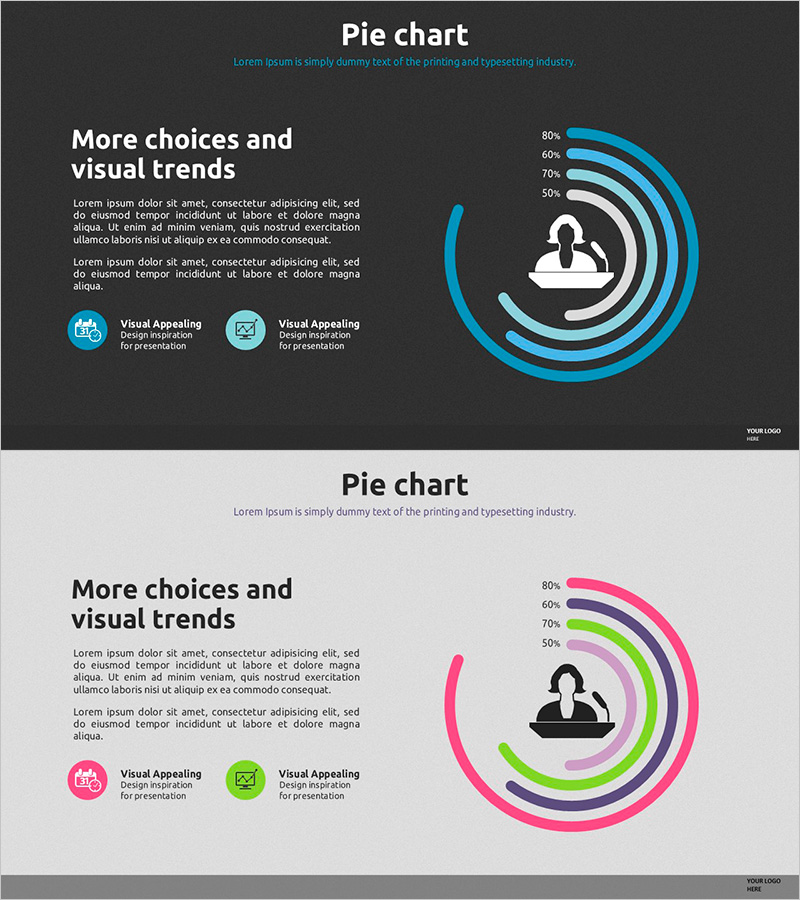
A two-slide PowerPoint presentation featuring circular donut gauge charts for visualizing competitive advantage and product positioning. Available in dark and light background versions, each slide displays four concentric gauge rings with a central icon for emphasis. Ideal for product introductions, competitive analysis, and development status reports. Easily edit percentages and labels in PowerPoint to represent your own data and metrics across multiple comparison dimensions.
Usage Points
-
Main Usage
Displays competitive positioning, technical capabilities, market share, or performance metrics across four dimensions using concentric donut gauges. The central icon reinforces the presentation topic. Effectively communicates multi-factor comparisons to executives, investors, and stakeholders during product launches and strategic reviews.
-
How to Use
Replace the default percentages (50%, 60%, 70%, 80%) with your actual data values and update label text to match your analysis categories. Use the dark background version for large conference rooms and outdoor projection; select the light version for intimate boardroom settings. Customize colors to align with corporate branding guidelines.
-
Recommended For
Product managers, marketing professionals, sales executives, and business development teams presenting competitive analysis, product differentiation, and technology roadmaps. Recommended for startup pitch decks, corporate strategy meetings, management presentations, and consulting reports.
-
Slide Structure
Two-slide set with title area, descriptive text block, four concentric donut gauge rings in blue and gray tones, central icon (cloud or user symbol), and two legend icons per slide. 16:9 widescreen format optimized for modern presentation environments and digital displays.
Related Products
-

Competitive Advantage Analysis Silhouette Graph – Market and Competitor Insights
#Product/Service Introduction #Market and Competitor Analysis #Graph
-

Component Development Scale Pie Chart – Visualization of Competitive Advantage
#Product/Service Introduction #Market and Competitor Analysis #Graph
-

Camera Donut Chart and Table – Market and Competitive Analysis
#Product/Service Introduction #Market and Competitor Analysis #Graph
-

Competitive Advantage Analysis Diagram – Drive to Market Success
#Product/Service Introduction #Market and Competitor Analysis #Diagram
