3D Scheme Infographics to Visualize Business Strategy – Empowerment and Efficiency
RJ0500017_13
- Last Update 06/11/2025
- File Size 2.1MB
- # of Slides 2
- File Format PPTX
- Slide Ratio 16:9
- Color
Keywords
- #Content-Based Slides
- #Design-Based Slides
- #Business Strategy
- #Operational Plan
- #Diagram
- #Step-by-Step Schedule Plan
- #Production and Technology Development Strategy
- #Spread
- #16:9
- #3D infographic PowerPoint
- #8-step diagram slide
- #business strategy visualization
- #cube structure presentation
- #radial infographic slide
About the Product
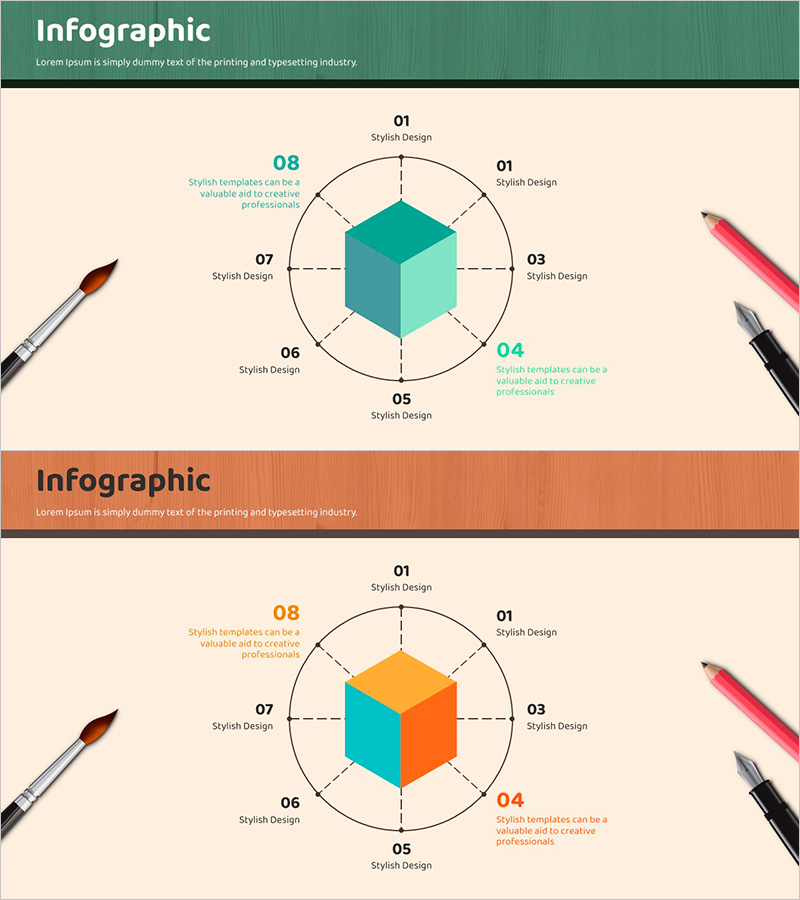
A PowerPoint slide that visualizes business strategy and operational planning through an 8-step 3D cube structure. The diagram features a central isometric cube surrounded by eight items arranged in a circular layout, effectively expressing each stage's role and interdependencies. The teal and orange dual-color scheme provides clear data emphasis and visual distinction, while brush illustration elements add creative appeal. This infographic slide is ready to use for strategy formulation, organizational capability analysis, and process flow explanation in presentations.
Usage Points
-
Main Usage
Optimized for expressing an organization's eight core competencies, business execution strategies, and operational plans in a hierarchical manner while emphasizing their interdependencies. The circular structure centered on the cube effectively communicates integrated thinking and cyclical processes.
-
How to Use
Use in executive briefings, strategy planning meetings, organizational restructuring announcements, and business plan presentations when explaining eight key elements. Edit the text in each section to customize for organizational goals such as empowerment, efficiency, collaboration, and innovation.
-
Recommended For
Ideal for executives, strategic planning teams, organizational development managers, and consultants presenting business vision and execution strategies. Suitable for business plans, management reports, and strategic presentations in manufacturing, IT, finance, and service industries.
-
Slide Structure
Circular layout with a central 3D cube surrounded by eight numbered items (01–08). Each item has independent text areas and description space, with dotted guidelines indicating hierarchical relationships. Two-slide set provides both single teal and dual-color versions for flexible presentation scenarios.
Related Products
-

Orange Red Diffusion Diagram – Business Area and Operations Plan
#Business Introduction #Operational Plan #Diagram
-

Infographic Slide Highlighting the Coffee Bean Development Process
#Business Strategy #Operational Plan #Diagram
-

Cosmetic Production Strategy Slide Template – Premium Quality Design
#Product/Service Introduction #Operational Plan #Diagram
-

PowerPoint Template for Technology Status and Introduction – Innovation and Performance
#Business Introduction #Operational Plan #Diagram
