Visualizing Company History with Line Flow – Notebook and Data
RJ0500016_4
- Last Update 06/11/2025
- File Size 0.3MB
- # of Slides 2
- File Format PPTX
- Slide Ratio 16:9
- Color
Keywords
- #Content-Based Slides
- #Design-Based Slides
- #Company Introduction
- #Diagram
- #History
- #Key Achievements
- #Flow
- #Linear Flow
- #16:9
- #linear timeline PowerPoint
- #company history diagram slide
- #flow chart presentation template
- #5-stage timeline template
- #business milestone visualization
- #how to create timeline in PowerPoint
About the Product
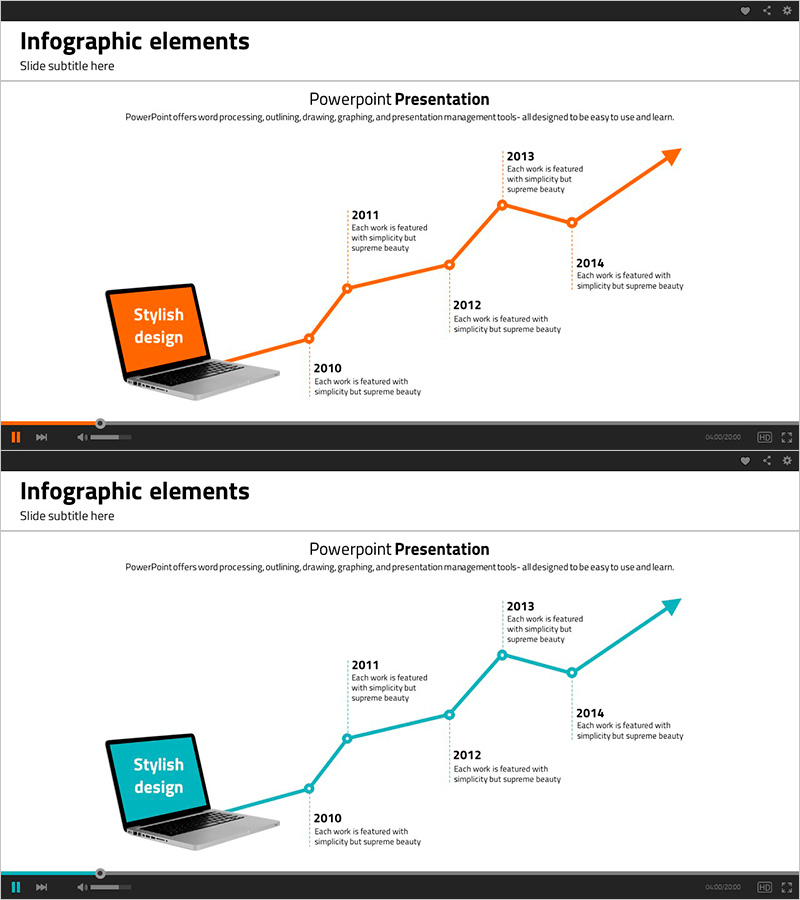
A linear timeline PowerPoint slide designed to visualize company history and project milestones in chronological order. This 2-slide set features both orange and teal color versions, each displaying a 5-node line flow connecting key years from 2010 to 2014. The left side includes a laptop mockup with a 'Stylish design' text highlight, while the right side presents year-by-year descriptions aligned vertically. The clean layout effectively communicates corporate growth, project progression, or product development phases in presentations, company profiles, and business reports.
Usage Points
-
Main Usage
This linear timeline diagram visualizes corporate history, project phases, or product development stages in chronological sequence. Five key milestones are connected by a flowing line, clearly showing growth trajectory and progression. Each stage includes descriptive text to enhance audience comprehension and engagement.
-
How to Use
Ideal for company profile presentations, business reports, investor pitch decks, and product launch presentations. Simply edit the year labels and description text to match your data, then select the color version that aligns with your document's visual identity. The template is fully editable and ready for immediate use.
-
Recommended For
Business executives, marketing managers, project managers, business development professionals, and investor relations specialists who need to communicate corporate growth stories, project timelines, or milestone achievements. Perfect for annual reports, investor presentations, and strategic planning sessions.
-
Slide Structure
Two-slide template featuring identical linear timeline layouts in orange and teal. Each slide displays 5 connected nodes (2010, 2011, 2012, 2013, 2014) arranged in a left-to-right ascending line flow. Left side contains laptop mockup and emphasis text box; right side shows year-by-year descriptive text in a vertical stack for clear information hierarchy.
Related Products
-

Timeline Slide Visualizing Historical Development – Business Insights
#Company Introduction #Diagram #History
-

Performance-Based Business History – Flowing Toward Success
#Company Introduction #Diagram #History
-

Illustration Template for Writing Instruments – Company History and Key Achievements
#Company Introduction #Diagram #History
-

Simple Timeline to Visualize Milestones
#Company Introduction #Diagram #History
