Timeline Slide Visualizing Historical Development – Business Insights
RM0500011_5
- Last Update 11/07/2025
- File Size 8.8MB
- # of Slides 2
- File Format PPTX
- Slide Ratio 16:9
- Color
Keywords
About the Product
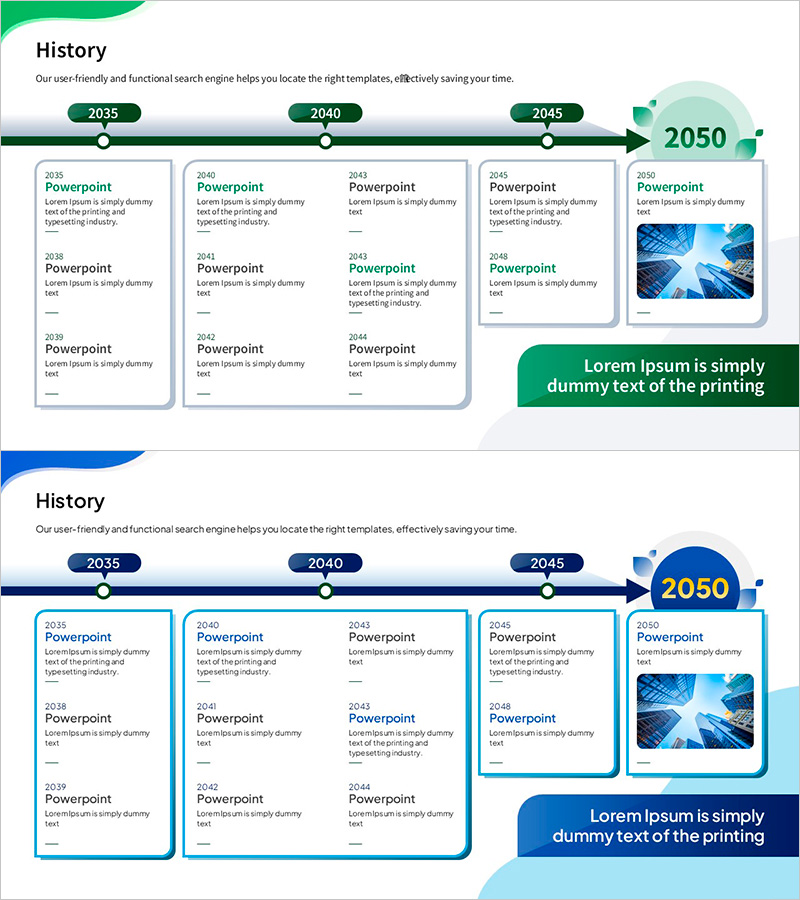
A 5-stage timeline diagram PowerPoint slide that visualizes your company's historical development and future business outlook from 2035 to 2050. Each milestone and achievement is clearly organized in a linear progression format, making it ideal for corporate presentations. The design features a green progress bar and white card-based layout that effectively separates information hierarchy. With 2 slides included, this template is ready to use for company introductions, business plans, growth strategies, and investor presentations. The structured timeline format helps audiences understand your organization's trajectory and strategic vision at a glance.
Usage Points
-
Main Usage
Communicate your organization's historical development and future vision through a clear linear timeline that helps audiences understand your growth trajectory. The card-based layout organizes key milestones and achievements by period, improving readability and creating a natural narrative flow for your presentation.
-
How to Use
Replace the year labels (2035, 2040, 2045, 2050) with your actual timeline periods. Fill each card with relevant events, achievements, or plans for that period. Adjust card heights based on text length, and add or remove cards as needed to match your content requirements.
-
Recommended For
Company overview presentations, business plan explanations, investor pitch decks, annual performance reports, strategic planning meetings, employee onboarding sessions, and any presentation where you need to showcase organizational history and future direction to stakeholders.
-
Slide Structure
Consists of 1 progress bar (green curved line at top-left + horizontal center line + right arrow), 4 year badges (2035, 2040, 2045, 2050), 12 information cards (3-4 items per year period), 1 highlighted 2050 section with image placeholder on right side, and 1 summary text box at bottom.
Related Products
-

Simple Timeline to Visualize Milestones
#Company Introduction #Diagram #History
-

Illustration Template for Writing Instruments – Company History and Key Achievements
#Company Introduction #Diagram #History
-

Writing Instrument Illustration Template History Diagram – Capturing Visual Appeal
#Company Introduction #Diagram #History
-

Performance-Based Business History – Flowing Toward Success
#Company Introduction #Diagram #History
