Visualizing Development Status with Donut Chart – Colored Pencil Illustration
RJ0500015_4
- Last Update 06/11/2025
- File Size 6MB
- # of Slides 2
- File Format PPTX
- Slide Ratio 16:9
- Color
Keywords
- #Content-Based Slides
- #Design-Based Slides
- #Product/Service Introduction
- #Graph
- #Development Status
- #Circles
- #Doughnut Chart
- #16:9
- #donut chart PowerPoint
- #pie chart slide template
- #progress visualization presentation
- #development status PPT
- #percentage chart slides
- #project tracking PowerPoint template
About the Product
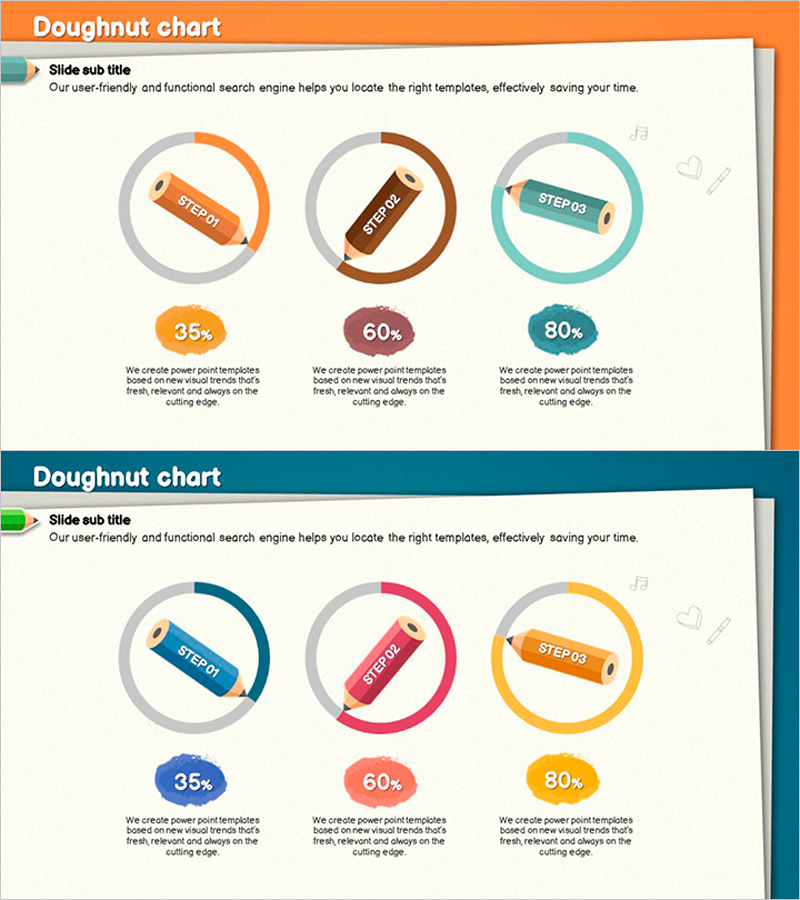
A 2-slide PowerPoint presentation featuring three donut charts with colored pencil illustration style to visualize development progress, project completion rates, and milestone status. Each donut displays percentages (35%, 60%, 80%) with matching colored pencil icons in warm orange, brown, and teal tones. The 16:9 aspect ratio slides include descriptive text areas below each chart for adding detailed stage information. Ideal for project reports, team presentations, and status updates where parallel progress tracking across multiple phases needs clear visual communication.
Usage Points
-
Main Usage
Displays three concurrent project phases or development stages simultaneously using donut charts, enabling audiences to compare progress across multiple workstreams at a glance. Percentage values and supporting text areas provide both quantitative metrics and contextual details for each stage.
-
How to Use
Insert into project status reports, development team presentations, quarterly business reviews, and milestone tracking meetings. Customize the text areas below each donut with stage names (Planning, Development, Testing, etc.) and supporting descriptions to match your specific project phases.
-
Recommended For
Project managers, development team leads, business analysts, and product owners presenting parallel project progress. Particularly effective for demonstrating multi-phase initiatives where stakeholders need to assess completion status across different workstreams simultaneously.
-
Slide Structure
2-slide deck with 3 donut charts arranged horizontally on each slide. Each donut contains a percentage value (35%, 60%, 80%) with a colored pencil icon at the center. Color-coded by stage: orange (STEP01), brown (STEP02), teal (STEP03). Text description areas positioned below each chart for customization.
Related Products
-

Development Status Analysis Comparison Graph – Market Share & Growth
#Product/Service Introduction #Market and Competitor Analysis #Graph
-

Financial Management Analysis Status Graph
#Product/Service Introduction #Business Introduction #Graph
-

Donut Chart Slide for Major Cultivation Countries
#Product/Service Introduction #Market and Competitor Analysis #Graph
-

Exercise Objectives Achieved Diagram & Chart – Post-Progress
#Product/Service Introduction #Business Introduction #Diagram
