3 Radial Graphs – Market Analysis Slide
RJ0500013_13
- Last Update 06/10/2025
- File Size 6MB
- # of Slides 2
- File Format PPTX
- Slide Ratio 16:9
- Color
Keywords
- #Content-Based Slides
- #Design-Based Slides
- #Market and Competitor Analysis
- #Graph
- #Market Analysis
- #Other
- #Radar Chart Spider Chart
- #16:9
- #radial chart PowerPoint
- #radar chart template
- #5-axis data visualization
- #market analysis slide
- #competitive comparison chart
- #radial diagram PowerPoint template
About the Product
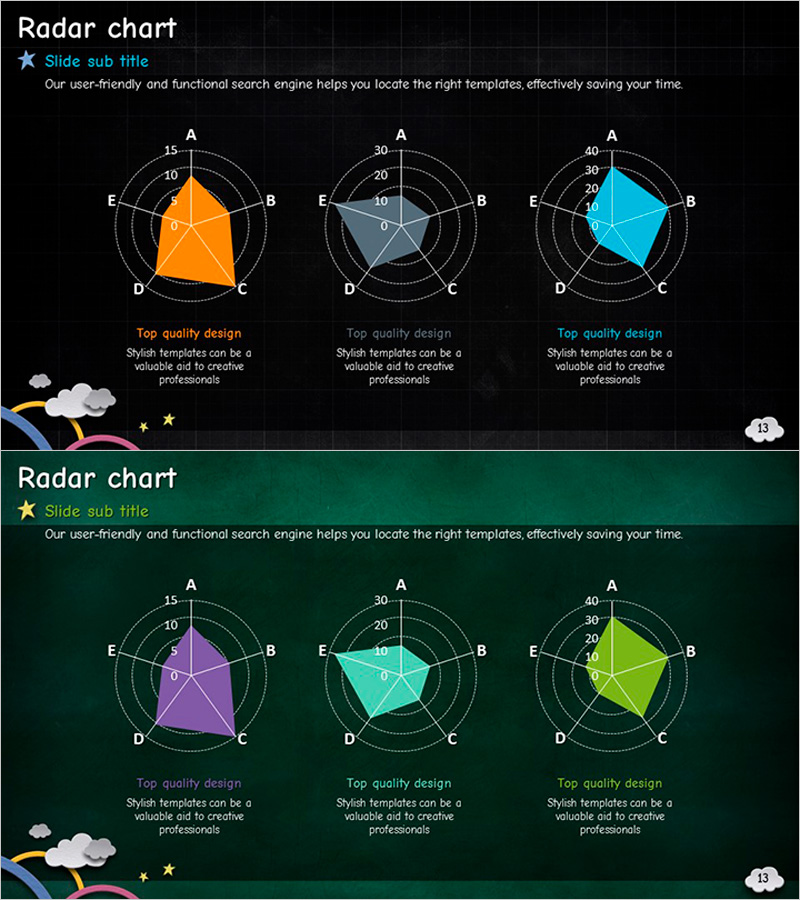
A PowerPoint template featuring three radial (radar) charts with 5-axis scales arranged on a single slide. Each chart uses distinct colors—orange, gray, and cyan—to represent different data series, with filled polygonal areas on concentric grid backgrounds for intuitive numerical comparison. Ideal for market analysis, competitive benchmarking, and capability assessment presentations. The template supports multi-dimensional data visualization where each axis (A, B, C, D, E) represents a different evaluation metric. Available in 16:9 widescreen format, PPTX file type, fully editable in all PowerPoint versions.
Usage Points
-
Main Usage
Simultaneously compares five evaluation dimensions (axes A, B, C, D, E) and reveals strengths and weaknesses at a glance. Three color-coded series (orange, gray, cyan) distinguish different subjects—competitors, scenarios, or time periods—making it ideal for market positioning, competitive analysis, and organizational capability assessment.
-
How to Use
Edit the five axis values (0–40 scale) on each radial chart to input actual data. The polygon shape and area size visually represent data profiles for comparison. Customize axis labels, titles, and colors to match your presentation context. The three side-by-side charts enable temporal trends, scenario comparisons, or multi-subject evaluations.
-
Recommended For
Recommended for strategists, business analysts, consultants, and marketers developing market strategies, executive reports, consulting proposals, and business analysis presentations. Particularly valuable for roles requiring quantified qualitative assessments to support decision-making.
-
Slide Structure
Two-slide template with three 5-axis radial charts per slide arranged horizontally. First slide features black background with orange, gray, and cyan charts; second slide uses dark green background with purple, cyan, and lime charts for design variety. Each chart includes descriptive text area below for analysis commentary.
Related Products
-

Radial Graph of Data Analysis by Year – Market and Competitive Analysis
#Market and Competitor Analysis #Graph #Market Analysis
-

Real Estate Analysis Charts by Consumer Characteristics – Graphs for Market Insights
#Product/Service Introduction #Market and Competitor Analysis #Graph
-

Geometric Pattern Wide PPT Radar Chart – Optimized for Market Analysis Visualization
#Market and Competitor Analysis #Graph #Market Status
-

Goal Setting & Radial Graph – Intuitive Data Visualization
#Business Introduction #Market and Competitor Analysis #Diagram
