Global Map and Detailed Explanation – Effective Presentation for Market Analysis
RJ0500007_31
- Last Update 06/09/2025
- File Size 1.8MB
- # of Slides 2
- File Format PPTX
- Slide Ratio 16:9
- Color
Keywords
About the Product
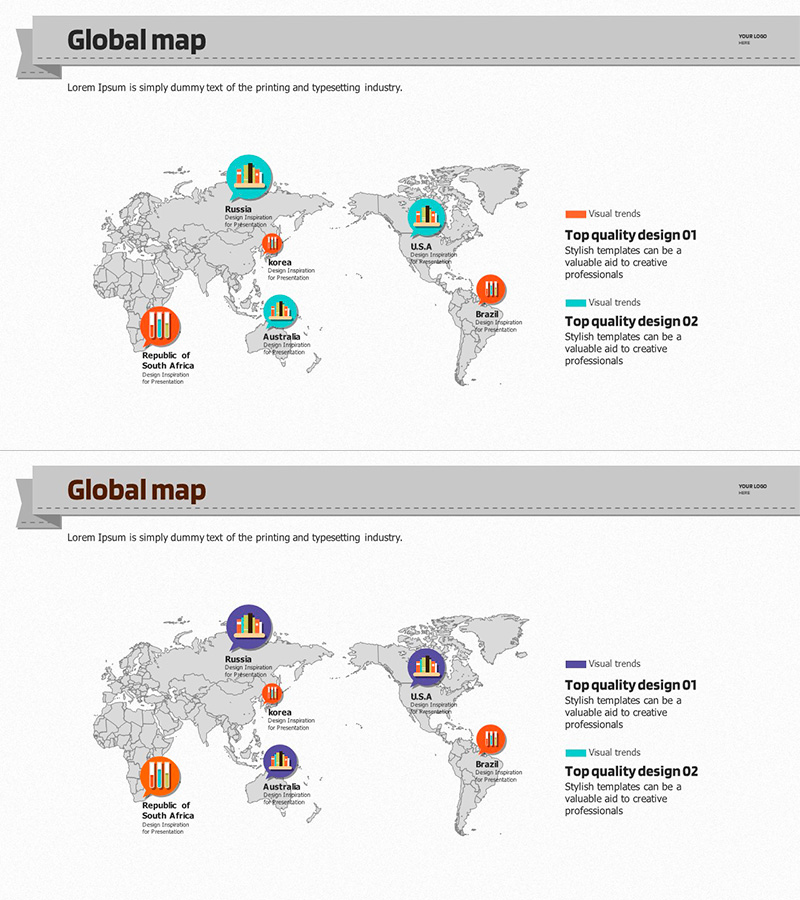
A world map-based PowerPoint slide that presents global market conditions at a glance. This presentation slide visualizes key market data for Russia, USA, Australia, Brazil, Korea, and South Africa using icons and charts, making it ideal for international market analysis presentations. The gray-toned background map contrasts with cyan and orange accent icons, ensuring excellent information readability. The 2-slide set includes a base global map version and a color variation, allowing you to choose the design that best matches your presentation style. Fully editable in PPTX format, you can customize country data, text labels, and legends to fit your specific needs.
Usage Points
-
Main Usage
Effectively visualizes international market conditions, global business expansion status, and regional competitor analysis. The world map with country-specific data icons and charts enables intuitive communication of complex global information to stakeholders.
-
How to Use
Use in investor pitch decks, business plans, and market analysis reports within the market overview and competitive analysis sections. Click on country icons to input text and numerical data, and modify the legend to match your presentation theme.
-
Recommended For
Ideal for executives of global startups and mid-sized companies, marketing teams planning overseas market entry, international business analysts, and professionals at consulting firms and investment companies.
-
Slide Structure
2-slide set featuring a cyan icon version on the first slide and a purple icon version on the second. Each slide contains a world map background, 6 country location markers with text labels, data visualization icons (bar charts), and a legend area on the right side for customization.
Related Products
-

Analysis Graph of Young and Old Age Groups – Market and Competitive Insights
#Market and Competitor Analysis #Graph #Other
-

Global Market Analysis Using World Map – Sea Lighthouse Concept
#Market and Competitor Analysis #Diagram #Other
-

Market Analysis with Hologram Map and Chart – Contemporary Visual Design
#Market and Competitor Analysis #Marketing Plan and Strategy #Other
-

Asian Target Market Analysis Graph
#Market and Competitor Analysis #Graph #Other
