Diagram for Education-Related Measures
RJ0500007_28
- Last Update 06/09/2025
- File Size 1.2MB
- # of Slides 2
- File Format PPTX
- Slide Ratio 16:9
- Color
Keywords
About the Product
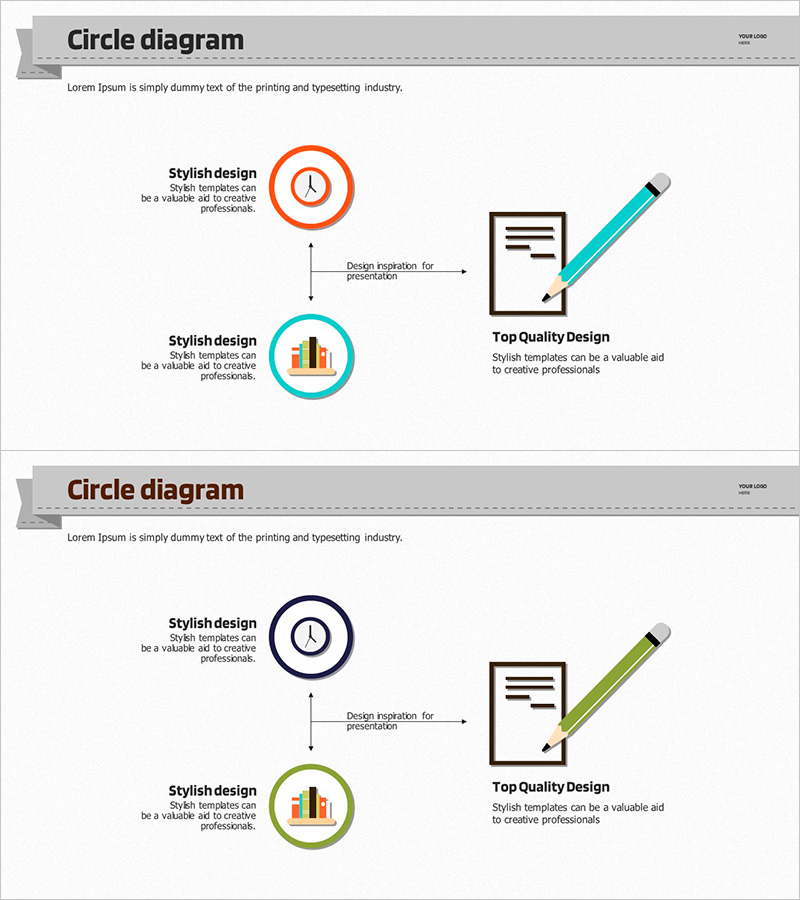
A visually effective circle diagram PowerPoint slide for presenting service implementation strategies and execution plans. This 2-slide set uses orange and turquoise circular icons to clearly represent step-by-step processes. Each stage includes dedicated text description areas, making it immediately applicable for education-related presentations, service operation strategies, technology department explanations, and more. Connection lines and arrows emphasize cause-and-effect relationships, while the right side features a final deliverable icon (document and pen) to visualize execution outcomes. In PPTX format with fully editable text and colors, it integrates seamlessly into corporate presentations, educational materials, and consulting proposals.
Usage Points
-
Main Usage
Optimized for visualizing service operation strategies, education-related initiatives, and technology department explanations as sequential processes. The circular icons and connecting lines clearly convey cause-and-effect relationships and logical flow, while the final deliverable icon emphasizes execution outcomes.
-
How to Use
Edit the text within each circular icon and the left-side description areas with your own content. Colors can be customized to match your corporate brand, and the right-side deliverable icon can be replaced based on your presentation objectives. Apply directly to educational materials, business proposals, and operational planning presentations.
-
Recommended For
Ideal for educational institutions and corporate training teams, service operation managers, IT and consulting professionals requiring technology explanations, and marketing or strategy teams presenting business initiatives. Effective for executive briefings, client proposals, and internal training materials.
-
Slide Structure
2-slide composition with 2 circular icons per slide (text-editable), 2 left-side description text areas, and 1 right-side deliverable icon. Vertical connection lines and arrows express relationships between stages, optimized for 16:9 widescreen format.
Related Products
-

Circular Three-Sector Model Slide – Clarifying Service Operations
#Technical Approach #Diagram #Service Operation Plan
-

Presentation Template Emphasizing Visual Appeal - The Power of Visual Elements
#Technical Approach #Diagram #Service Operation Plan
-

Automobile Management Service System – Efficient Operation Strategy
#Technical Approach #Diagram #Service Operation Plan
-

Blue Line Wide Template Connection Diagram – Presenting Service Operation Plans
#Technical Approach #Service Operation Plan #Service Implementation Plan
