Circular Chart for Business Processes
RJ0500007_19
- Last Update 06/09/2025
- File Size 1.2MB
- # of Slides 2
- File Format PPTX
- Slide Ratio 16:9
- Color
Keywords
About the Product
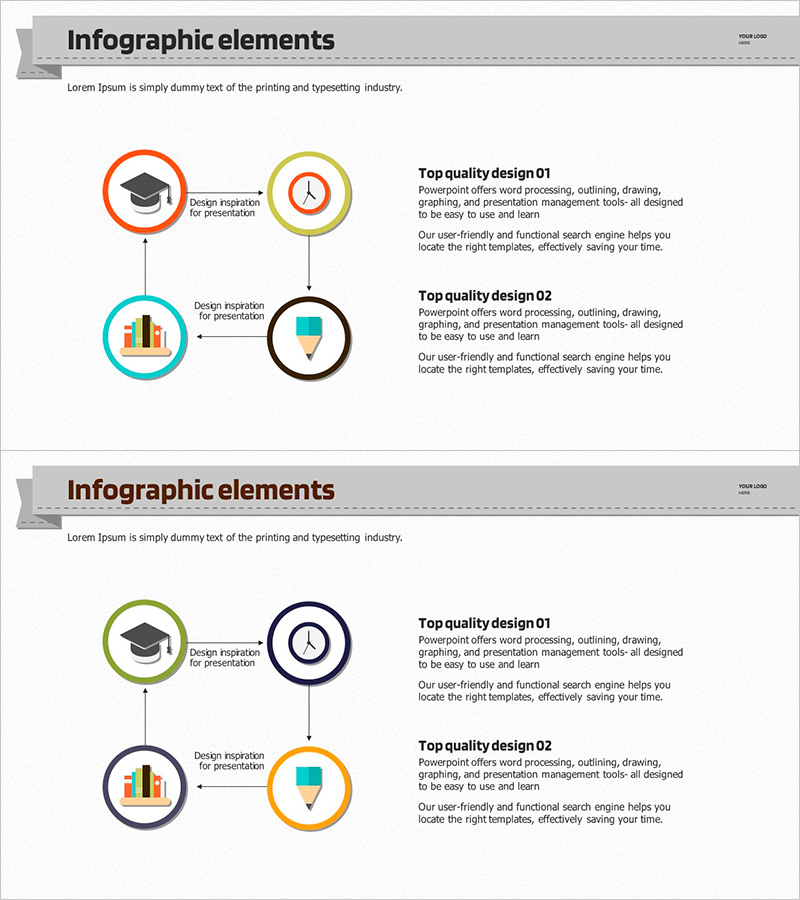
A 4-step circular diagram PowerPoint slide that visualizes business process cycles and operational workflows. Four circular nodes representing education, time management, data analysis, and decision-making are connected by directional arrows to create a clear cycle structure. Each stage is distinguished by distinct colors—red, yellow, cyan, and black—enhancing presentation readability. The 2-slide set offers multiple background color options and is optimized for 16:9 widescreen format. Ready-to-use presentation slides for explaining organizational workflows, project management cycles, and operational planning.
Usage Points
-
Main Usage
Illustrates repetitive business processes, project cycles, and operational planning stages in a visual format. The 4-node circular structure—education, time, data, and decision—clearly demonstrates workflow relationships and enhances audience comprehension.
-
How to Use
Enter department names, process titles, or responsible parties into each circular node. Use the arrow direction to explain workflow progression. Customize by changing node colors to emphasize priority levels or replacing icons to match industry-specific or departmental needs.
-
Recommended For
Executives, team leads, and project managers explaining organizational workflows, quality management cycles, and marketing campaign processes. Ideal for training sessions, seminars, business meetings, and consulting presentations.
-
Slide Structure
2-slide set. Each slide features 4 circular nodes (approximately 80px diameter) arranged in 2×2 layout with directional arrows connecting clockwise. Each node includes an icon (education, time, graph, pen). Slide 1 has light background; Slide 2 has dark background.
Related Products
-

Business Process Pentagon 3D Diagram – Visualizing Operational Plans
#Operational Plan #Technical Approach #Diagram
-

Research Phase Process Slide Design - Business Strategy
#Business Strategy #Operational Plan #Diagram
-

Work Principles & Collaboration Stack Slide – Dark & Light
#Business Strategy #Operational Plan #Diagram
-

Weather Flow Diagram – Advanced Technical Planning
#Operational Plan #Technical Approach #Diagram
