Schedule Slide Template for Efficient Journeys
RJ0200029_7
- Last Update 04/06/2025
- File Size 0.1MB
- # of Slides 2
- File Format PPTX
- Slide Ratio 16:9
- Color
Keywords
- #Content-Based Slides
- #Design-Based Slides
- #Business Management
- #Operational Plan
- #Diagram
- #Implementation Schedule
- #Project Implementation Schedule
- #Table
- #Standard Table
- #16:9
- #schedule table PowerPoint
- #monthly timeline slide template
- #project schedule diagram
- #Gantt chart PowerPoint
- #operational planning slide
- #horizontal schedule template download
About the Product
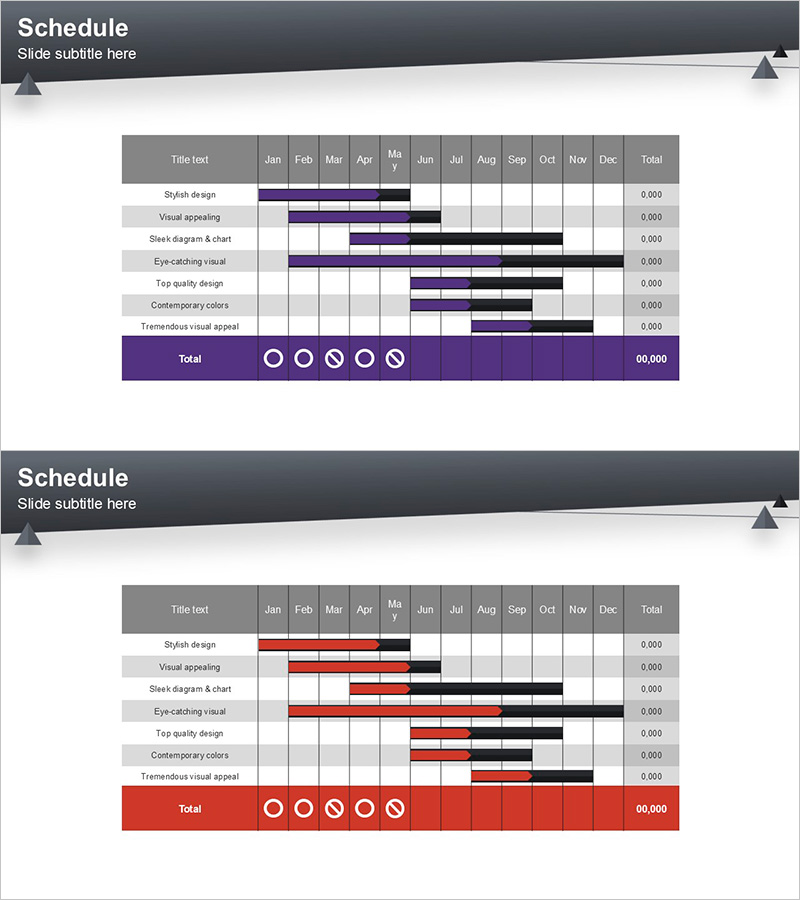
A comprehensive horizontal schedule table PowerPoint slide designed for project timeline management and operational planning presentations. This slide deck features a 12-month timeline matrix with task items displayed as horizontal bar charts, enabling stakeholders to visualize project phases and milestones at a glance. Two color variations are included—purple and red accent versions—each with a dark gray header, progress indicator icons, and total calculation fields. Delivered in 16:9 widescreen PPTX format for immediate editing and customization. Ideal for business plans, operational reports, marketing strategies, investment pitches, and project management presentations.
Usage Points
-
Main Usage
Visualize and communicate monthly project timelines, operational schedules, and marketing campaign phases across a 12-month period. The horizontal bar chart layout clearly shows task start dates, end dates, and duration, making it easy for teams to understand project phases and dependencies.
-
How to Use
Insert into business plan presentations for implementation timelines, operational reports for annual schedules, marketing strategy decks for campaign roadmaps, and investor pitch decks for product development roadmaps. Edit task names, adjust bar lengths to match actual dates, and modify colors to align with corporate branding.
-
Recommended For
Project managers, operations directors, marketing strategists, and executives presenting annual or quarterly schedules. Particularly effective for complex multi-task projects requiring clear timeline visualization and stakeholder alignment on project phases.
-
Slide Structure
Two-slide set featuring a 12-column month grid (January through December), seven task item rows, and a Total row with progress indicator icons and numerical values. Purple version uses deep violet bars; red version uses crimson bars. Each slide includes a gray title header and right-aligned total calculation column.
Related Products
-

Displays the Schedule Step by Step – Clear Communication of Project Timeline
#Business Management #Operational Plan #Diagram
-

Yearly Progress Schedule Plan Visualized for Project Management
#Business Management #Operational Plan #Diagram
-

Summer Template Planning Table Chart – Optimizing Business Management and Operations
#Business Management #Operational Plan #Diagram
-

Surgery Schedule Planning – Effective Business Management
#Business Management #Operational Plan #Diagram
