Green Blue Comparative Double Bar Graph – Optimized for Market Analysis
RJ0500005_17
- Last Update 06/08/2025
- File Size 0.2MB
- # of Slides 2
- File Format PPTX
- Slide Ratio 16:9
- Color
Keywords
- #Content-Based Slides
- #Design-Based Slides
- #Market and Competitor Analysis
- #Graph
- #Market Analysis
- #Horizontal Bar
- #Double Horizontal Bar
- #16:9
- #double bar chart PowerPoint
- #comparative bar graph slide
- #horizontal bar chart template
- #data comparison PPT slide
- #market analysis chart template download
About the Product
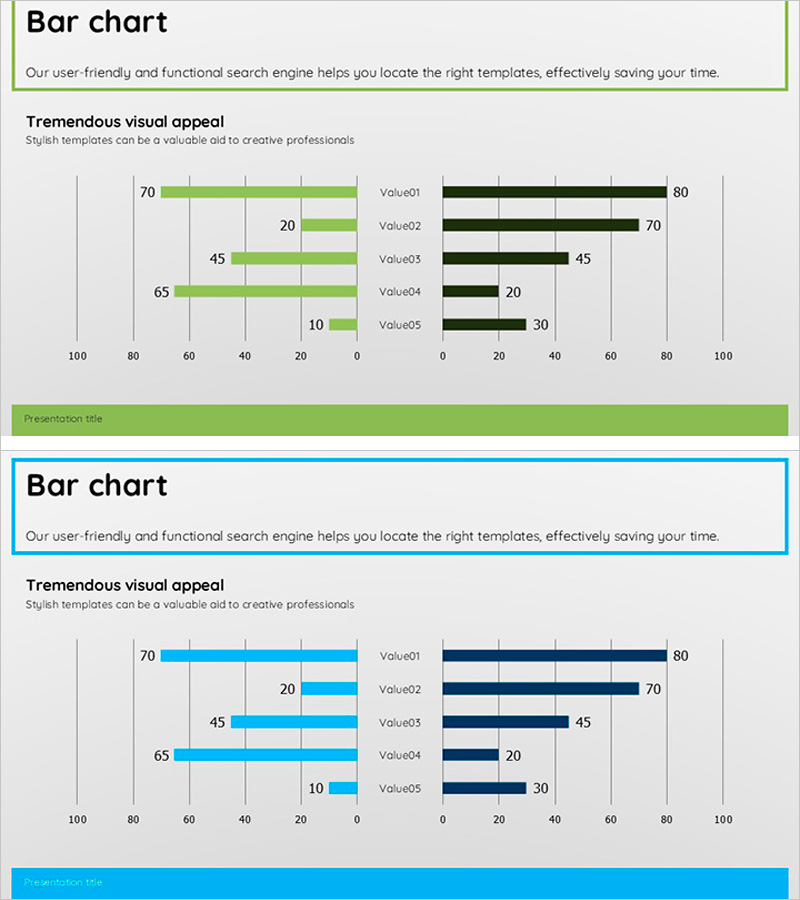
A horizontal double bar chart PowerPoint slide optimized for market analysis and comparative data visualization. The green and blue dual-tone color scheme enables side-by-side comparison of five data items with clear numerical values (70, 20, 45, 65, 10) displayed on a normalized 0–100 horizontal scale. This fully editable presentation template is ready for immediate use in business reports, market analysis decks, marketing proposals, and executive presentations. The intuitive layout makes it easy to highlight performance gaps, competitive benchmarks, or year-over-year trends.
Usage Points
-
Main Usage
This slide specializes in displaying two data series side-by-side for direct comparison. Ideal for market share analysis, competitive performance benchmarking, year-over-year revenue comparison, budget versus actual spending, or any scenario requiring parallel data visualization.
-
How to Use
Double-click each data value to edit numbers directly; bar lengths adjust automatically. Modify series labels (Value01–Value05) by clicking the legend. Customize colors in the shape formatting menu to match your brand palette. Edit the title and descriptive text boxes freely to fit your narrative.
-
Recommended For
Marketing teams presenting market analysis reports, sales teams comparing performance metrics, executive leadership strategy meetings, consulting proposals with benchmarking sections, finance teams analyzing budget variance, and competitive intelligence presentations.
-
Slide Structure
Two-slide layout: the first features five green horizontal bars representing one data series; the second displays five blue horizontal bars for the comparison series. Each slide includes a title area, descriptive text box, 0–100 horizontal axis scale, five item labels, and numeric value indicators positioned at bar endpoints.
Related Products
-

Five Color PowerPoint Template Wide – Bilateral Bar Graph Comparison
#Market and Competitor Analysis #Graph #Market Analysis
-

Comparative Horizontal Bar Chart – Market and Competitor Analysis
#Market and Competitor Analysis #Graph #Market Analysis
-

User Gender Ratio Analysis Graph – Effective Customer Insights
#Market and Competitor Analysis #Graph #Customer Analysis
-

Bar Chart Analysis of Causes of Marital Conflict
#Market and Competitor Analysis #Graph #Customer Analysis
