Gauge Charts by Area of Study – Highlighting Technological Innovations
RJ0500004_7
- Last Update 06/08/2025
- File Size 1.8MB
- # of Slides 2
- File Format PPTX
- Slide Ratio 16:9
- Color
Keywords
About the Product
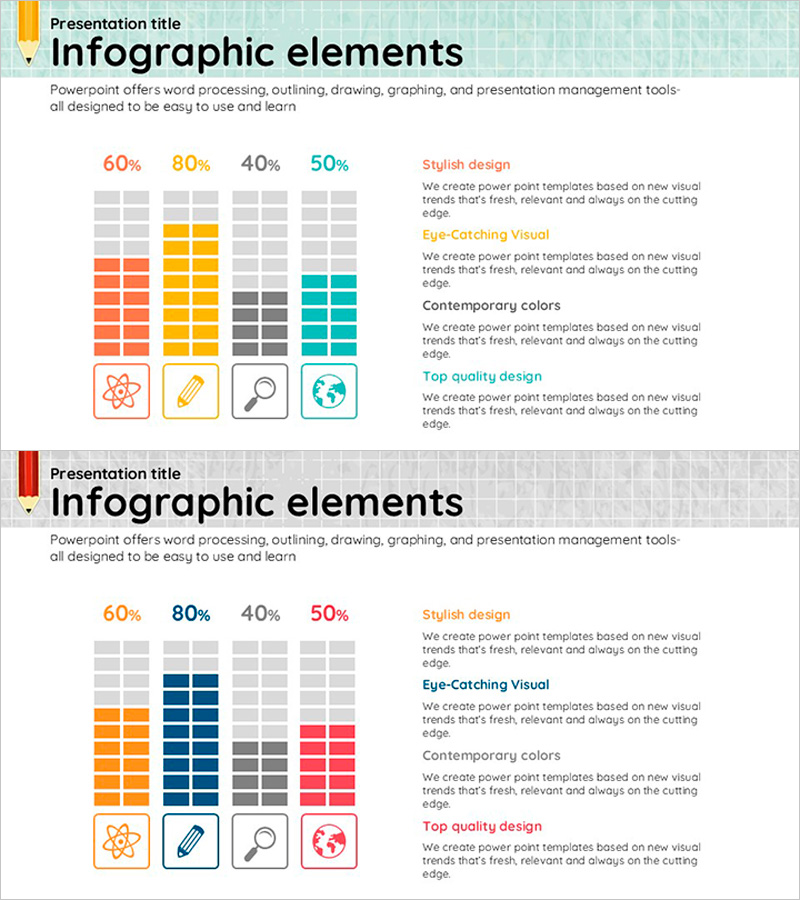
This slide features gauge charts that intuitively display the technological innovation status across various areas of study. With distinctive red, yellow, and teal colors, it presents an aesthetically pleasing design that allows for easy comparison of achievements and progress across fields. Ideal for presentations related to operational planning and technology status, this slide enhances audience comprehension and data readability. Text and chart areas are simple to modify, with an overall editing difficulty rated as 'easy' for quick integration.
Usage Points
-
Main Usage
- This template is designed for showcasing technological advancements in a clear and engaging manner during project updates or strategy meetings. It serves to facilitate discussions on current statuses and future directions in various fields of research and development.
-
How to Use
- Utilize this slide during team briefings to effectively convey the status of ongoing projects or when presenting to stakeholders who require a comprehensive overview of technological performance. It can be adapted for both formal presentations and collaborative discussions.
-
Recommended For
- This template is particularly beneficial for project managers, researchers, and executives engaged in technology assessment or operational planning. It is suitable for anyone who needs to report on developments and innovation trends in a structured format.
-
Slide Structure
- The layout consists of a series of visually distinct gauge charts, each representing different areas of technology. These charts are arranged to guide the audience through the narrative of achievements and progress, allowing for a logical flow of information.
Related Products
-

PowerPoint Template for Technology Status and Introduction – Innovation and Performance
#Business Introduction #Operational Plan #Diagram
-

Tablet PC Mockup Vertical Bar Graph – Market Analysis and Tech Insights
#Business Introduction #Market and Competitor Analysis #Graph
-

Mobile App Service Development Status – Doughnut Chart Visualization
#Product/Service Introduction #Business Introduction #Graph
-

Mobile Financial Services Graph – Market and Technology Status
#Business Introduction #Market and Competitor Analysis #Graph
