Infographic Elements Illustration – Visualizing Workflow
RJ0500001_10
- Last Update 06/07/2025
- File Size 1.6MB
- # of Slides 2
- File Format PPTX
- Slide Ratio 16:9
- Color
Keywords
About the Product
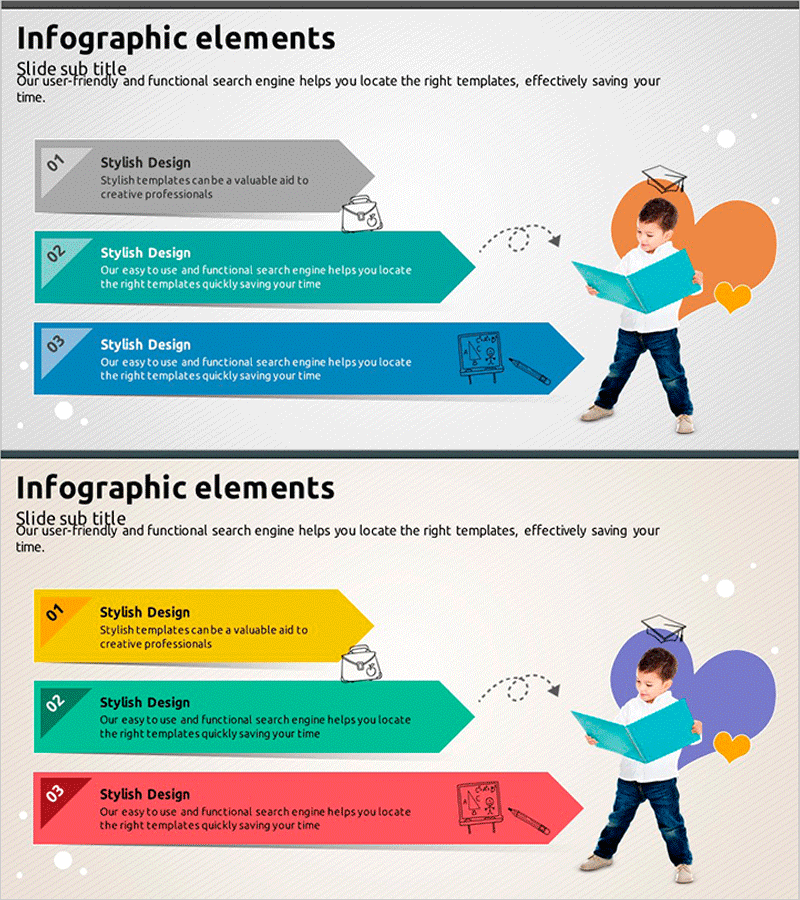
A professional arrow-based infographic PowerPoint slide designed to visualize 3-step linear processes clearly. This 2-slide template uses color-coded arrows (gray, teal, and blue) with numbered indicators to emphasize sequence and progression. Each step includes dedicated text areas and icon spaces, making it ideal for product introductions, workflow procedures, marketing funnels, and business presentations. The 16:9 widescreen PPTX format allows full customization, while the illustrated character and heart-shaped accent elements on the right create a friendly, approachable tone.
Usage Points
-
Main Usage
Clearly communicate 3-step linear workflows such as product development stages, marketing funnels, customer journeys, and business processes. Each step can include descriptive text and supporting icons to transform complex procedures into simple, visual narratives.
-
How to Use
Enter step titles and descriptions in each arrow box, then add relevant icons or images to the designated icon areas. Maintain the existing gray-teal-blue color scheme or customize with your brand colors. Duplicate the 2-slide template to present multiple processes or workflows in sequence.
-
Recommended For
Product teams explaining development phases, sales teams presenting customer acquisition processes, marketing teams visualizing campaign stages, training departments outlining learning paths, and consultants illustrating implementation roadmaps in business presentations.
-
Slide Structure
2-slide layout featuring 3 numbered arrow-shaped boxes arranged vertically on the left side of each slide. The right side displays an illustrated character with circular background elements. Clear text input areas and icon insertion spaces are provided for each step.
Related Products
-

Facility Process Flow – Efficiency and Innovation
#Business Strategy #Operational Plan #Diagram
-

Wide Template for Operational Plans – Green & Gray Diagram
#Operational Plan #Technical Approach #Diagram
-

Visualizing Daily Work Processes – Effective Operational Planning
#Business Strategy #Operational Plan #Diagram
-

The Process of Becoming a Successful Magician - Path to Success
#Business Strategy #Operational Plan #Diagram
