Travel Guide Industry Market Share Pie Chart
RJ0600063_7
- Last Update 07/07/2025
- File Size 1.8MB
- # of Slides 2
- File Format PPTX
- Slide Ratio 16:9
- Color
Keywords
About the Product
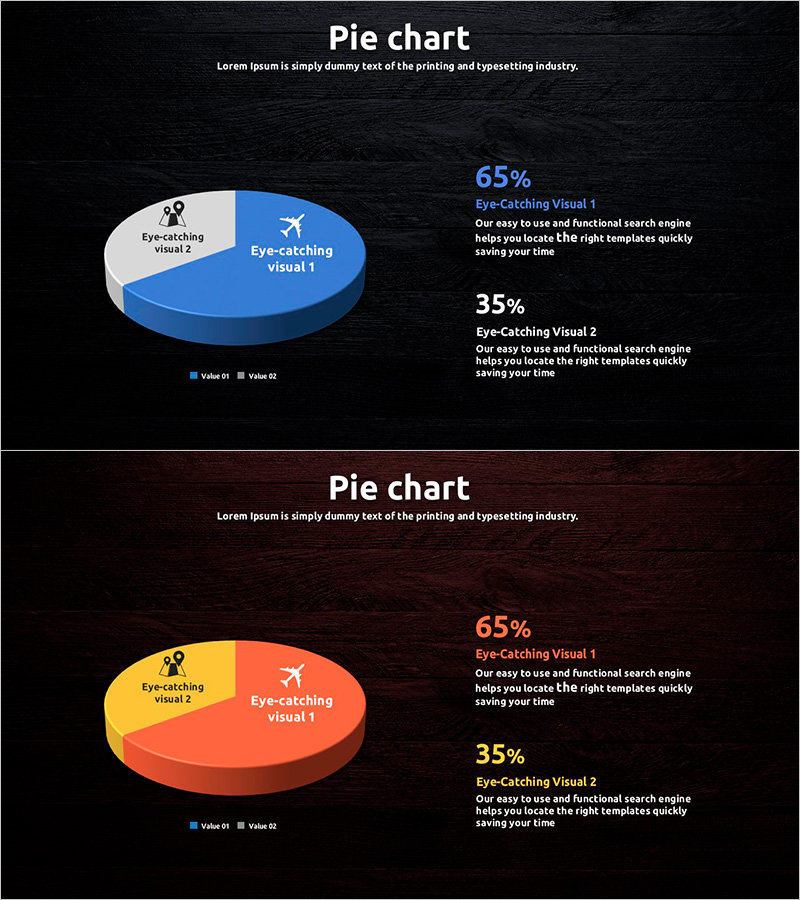
A professional pie chart PowerPoint slide comparing market share in the travel guide industry with two segments. The dark background features a 3D pie chart in blue and gray tones, clearly displaying 65% and 35% proportions with icons and labels for each section. Right-aligned numerical values and descriptive text enhance data clarity. The 2-slide set provides both blue and orange-yellow color versions, allowing you to match your presentation background and branding. Fully editable PPTX format lets you customize percentages and labels for various market analysis, competitive positioning, and business intelligence presentations.
Usage Points
-
Main Usage
Visualize two-category proportions such as market share, sales ratio, customer composition, and budget allocation using a 3D pie chart. The 65%-35% breakdown is immediately comprehensible, making it ideal for executive reports, investor presentations, and market analysis decks.
-
How to Use
Use in travel, tourism, hospitality, and airline industry analysis presentations to illustrate market conditions. Perfect for competitive analysis, customer segmentation, regional revenue breakdown, and any scenario requiring emphasis on relative proportions between two categories.
-
Recommended For
Executives and C-suite professionals presenting financial reports, investors reviewing pitch decks, marketing teams conducting market analysis, consulting firms presenting industry insights, and academics explaining statistical data.
-
Slide Structure
2-slide set with identical data structure in two color schemes. Each slide features a 3D 2-segment pie chart on the left, with numerical values (65%, 35%), category labels, and descriptive text vertically aligned on the right. Optimized for 16:9 widescreen format in modern presentation environments.
Related Products
-

Pie Chart for Oriental Medicines Market Overview
#Market and Competitor Analysis #Graph #Market Status
-

Two Pie Charts with Commentary – Market Share Analysis
#Market and Competitor Analysis #Graph #Market Status
-

Travel Survey Results – Market Share Visualization
#Market and Competitor Analysis #Graph #Market Status
-

Yellow Marketing Pie Chart – Market Share Analysis
#Market and Competitor Analysis #Graph #Market Status
