The Past and Present of Technological Advancements – Linear Flow Diagram
RJ0400074_4
- Last Update 06/07/2025
- File Size 7.2MB
- # of Slides 2
- File Format PPTX
- Slide Ratio 16:9
- Color
Keywords
About the Product
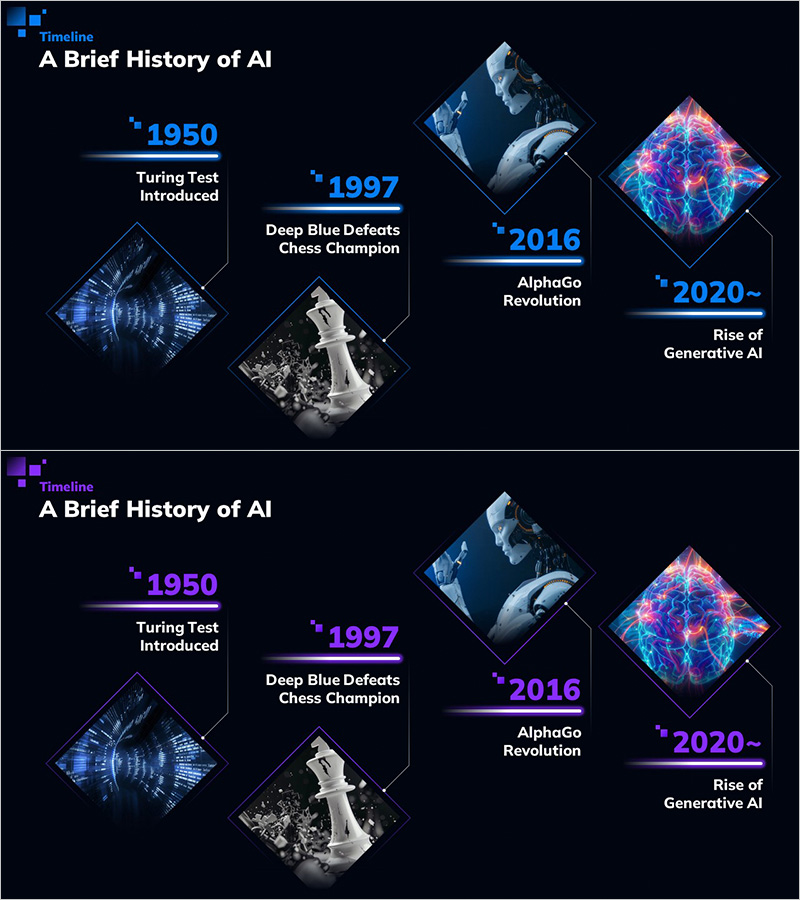
A linear flow diagram PowerPoint slide that visualizes major technological milestones in chronological order, from the 1950 Turing Test to the 2020s rise of generative AI. Four key stages are connected with flow lines, each featuring representative images and descriptive text. Set against a dark background with blue and purple accent colors, this presentation slide effectively illustrates the dynamic progression of technology. Instantly applicable to technology roadmaps, business progress reports, industry transformation analyses, and any presentation requiring timeline-based storytelling.
Usage Points
-
Main Usage
Clearly visualizes technology development, industry transformation, and business progress through a time-based linear process. The four-stage connected node structure effectively communicates cause-and-effect relationships and sequential progression, while representative images and text at each stage enhance audience comprehension.
-
How to Use
Customize the text and images at each stage to match your content. Connection lines and node colors can be changed to match corporate branding, and stages can be added or removed as needed. Suitable for technology presentations, executive briefings, investor pitches, educational seminars, and various professional speaking scenarios.
-
Recommended For
Ideal for technology companies reporting R&D progress, IT consultants presenting industry analysis, startups explaining technology roadmaps, university lectures on historical evolution, and corporate training programs outlining learning pathways. Particularly effective for technology, business, and strategy presentations where chronological sequence is critical.
-
Slide Structure
Two-slide layout featuring a blue accent version on the first slide and a purple accent version on the second. Each slide displays four connected nodes (1950, 1997, 2016, 2020~) arranged left to right, with representative images and text descriptions at each node. Optimized for 16:9 widescreen format for modern presentation environments.
Related Products
-

Green & Gray Template Wide History
#Company Introduction #Business Strategy #Diagram
-

Adventure Company History 4 Color Connection Diagram
#Company Introduction #Business Strategy #Diagram
-

Infinite Energy Wide PPT History – The Trajectory of Corporate Growth
#Company Introduction #Business Strategy #Diagram
-

Guiding Slide Representing Future Vision – Current Status of Business
#Company Introduction #Business Vision and Strategy #Business Strategy
