Operational Schedule Roadmap – Effective Business Promotion Strategy
RM0100011_20
- Last Update 01/28/2025
- File Size 1MB
- # of Slides 2
- File Format PPTX
- Slide Ratio 16:9
- Color
Keywords
- #Content-Based Slides
- #Design-Based Slides
- #Business Strategy
- #Operational Plan
- #Diagram
- #Roadmap
- #Project Implementation Schedule
- #Cluster
- #Table
- #Closed Cluster Diagram
- #16:9
- #Gantt chart PowerPoint
- #operational schedule slide
- #roadmap template
- #business timeline diagram
- #project management PPT
- #monthly timeline presentation
About the Product
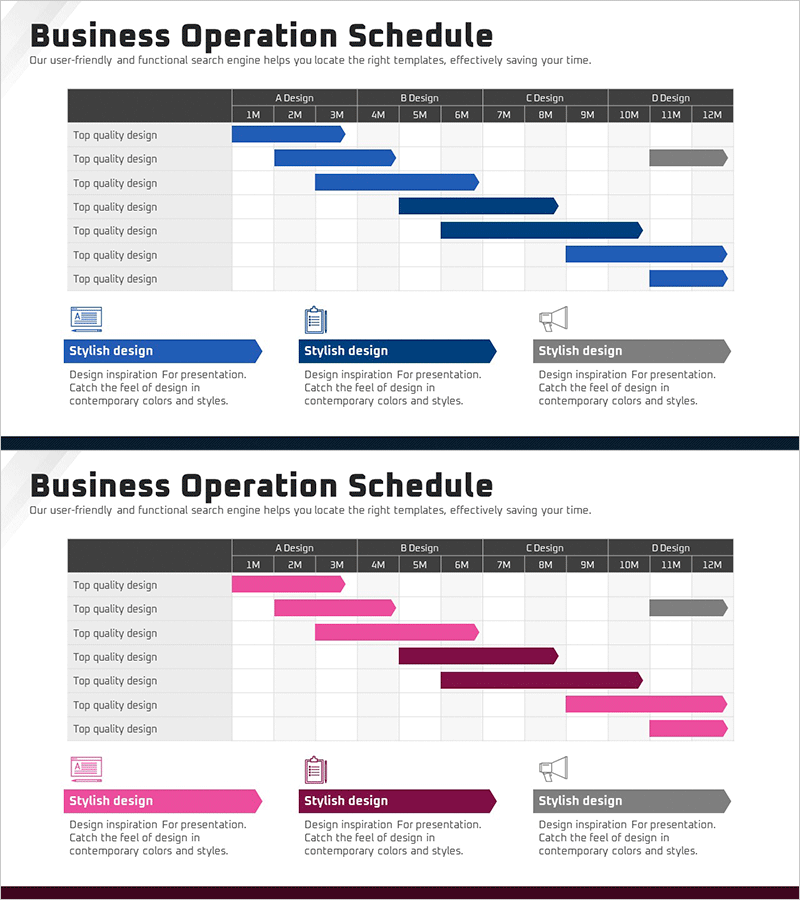
A Gantt chart-style PowerPoint slide for visualizing business operational schedules and project timelines. This presentation template displays seven implementation phases across a monthly timeline, with each phase duration represented by color-coded bars for quick visual comprehension. Featuring a dark background with blue, pink, and gray bars, this PPT slide deck is ideal for project management presentations, business plan pitches, and operational strategy briefings. The two-slide set offers multiple color variations and fully editable text and data fields for flexible customization.
Usage Points
-
Main Usage
Visualizes business operational schedules and project timelines across monthly periods using Gantt chart format. Each phase duration is clearly represented through color-coded bars, enabling stakeholders to comprehend the complete project schedule at a glance.
-
How to Use
Apply in executive briefings, business plan presentations, project kickoff meetings, and quarterly operational strategy sessions. Customize bar lengths and colors to match actual timelines, and modify text labels to adapt the template for various business promotion plans and project schedules.
-
Recommended For
Ideal for project managers, business planning teams, operations managers, and executive presentation specialists. Applicable across industries including construction, IT, manufacturing, and marketing for schedule management and strategic planning presentations.
-
Slide Structure
Two-slide set featuring seven-item Gantt charts with different color combinations (blue, pink, gray variations). Monthly timeline axis (1M–12M) runs horizontally with implementation items on the vertical axis, with bar lengths representing each phase duration.
Related Products
-

Big Data Development Schedule to Formulate Business Strategy
#Business Strategy #Operational Plan #Diagram
-

Business Idea Service Roadmap – Business Strategy
#Business Strategy #Operational Plan #Diagram
-

Big Data Analysis Schedule – Visualizing Business Strategy
#Business Strategy #Operational Plan #Diagram
-

Visualizing Business Strategy with Calendar Diagram
#Business Strategy #Operational Plan #Diagram
